
Updated October 23, 2026 — Version 2.0. Near final draft
We are not cutting fossil fuel use and emissions fast enough to protect current and future generations from escalating climate harm. Decades of delay have made the remaining task harder. Some losses will last far longer than a human lifetime. Yet the amount of additional suffering remains strongly influenced by what we do next.
This is a map of the barriers we must confront, paired with ways to weaken them. It is also an invitation to protect the people, places, and possibilities that can still be protected.
Three things this means for your daily life:
- Protect your household: heat, food costs, insurance, health, and power reliability belong in practical planning now.
- Use your influence: support policies and institutions that replace fossil fuels while protecting essential services and people with fewer resources.
- Choose a useful next step: begin with the Job One for Humanity Plan B, then keep working with others. You do not have to carry the whole planet on your shoulders before breakfast.
Five key facts:
- Global energy-related CO₂ reached another record in 2025. [2]
- Climate harm is already occurring; future generations inherit the consequences of today’s cumulative emissions. [5]
- Several climate processes can cross thresholds that are difficult to reverse. Their exact timing is uncertain. [19]
- Governments have met meaningful regional emissions targets. Those successes show that policy choices matter. [31, 32, 33, 34]
- The unresolved question is whether successful action will spread fast enough. The Plan B action steps give us useful work while that question is still open.
Executive summary: Our assessment is that existing institutions and policies are unlikely to deliver the rapid, coordinated fossil fuel reductions needed to minimize dangerous warming. This is an assessment of the present trajectory, not a claim that all outcomes are fixed. The ranked barriers below explain the shortfall. The separate record of successful action shows conditions under which people have changed direction. Protecting a livable future requires both rapid mitigation and practical preparation. Job One’s conditional 20–30% planning adjustment, the Climageddon Feedback Loop, and the limits of promised future carbon removal are explained below. The human-cost section separately identifies the mortality risk scenario and its evidentiary limits.
On this page: Key terms | Failure evidence | Current gap | Success evidence | 30 ranked barriers | Hansen warning | 20–30% adjustment | Carbon-removal risk | CFL | Human cost | Forecast | Plan B | Conclusion | FAQ | Glossary | Bibliography
Start here: what “irreversible” means—and what we can still change
Fossil fuels are coal, oil and natural gas. Burning them adds carbon dioxide (CO₂) to the atmosphere. Producing and transporting them can also release methane, another heat-trapping gas. Emissions are the gases released over a period; concentration is the amount already present in the air. These are related measurements, not interchangeable ones.
Mitigation reduces the causes of warming. Adaptation reduces harm from its effects. Resilience helps people and institutions keep functioning and recover. All three are needed.
A tipping point is a threshold beyond which a system can shift into a different state. A reinforcing feedback amplifies an initial change—for example, warming melts reflective ice, exposing darker surfaces that absorb more sunlight. A feedback can amplify warming without making the entire planet’s future uncontrollable. [19]
Irreversible on human timescales means recovery may take centuries or millennia, or that a loss, such as a species extinction, cannot be undone. Sea-level rise and ice-sheet changes have especially long consequences. The speed and eventual extent of those changes still depend on future warming. [5]
Net-zero CO₂ means human-caused CO₂ releases are balanced by human-caused removals. It is central to approximately stopping further CO₂-driven surface warming; major cuts in methane and other gases are also needed. Ocean and ice responses can continue after surface warming stabilizes. This distinction is why reducing emissions still matters enormously. [20]
There is no single scientific date when every climate problem becomes unsolvable. We have already lost some opportunities and suffered serious harm. We can still avoid making many outcomes worse.
Hansen’s warning: dangerous territory was reached long ago
In 2008, James Hansen and colleagues argued that atmospheric CO₂—then about 385 ppm—was already too high. They proposed an initial target of 350 ppm or less and warned that a prolonged overshoot could initiate catastrophic effects that would be difficult to reverse. [37]
The important warning is conditional: continued fossil fuel emissions and a failure to bring atmospheric CO₂ down can commit later generations to long-lived harm. Hansen’s paper strengthens the case for urgent action well before every impact becomes visible. It does not establish a precise, universal 386 ppm threshold after which every outcome becomes unavoidable. [37]
The practical implication is uncomfortable but motivating: being already in dangerous territory is a reason to reduce further damage immediately. Every additional commitment we avoid is one fewer burden passed to people who did not create it.
The precautionary principle: protect the future before certainty arrives
The precautionary principle calls for action when serious or irreversible harm is threatened, even before every detail is known. The 1992 climate convention explicitly includes this principle and the responsibility to protect future generations. [25]
Applied responsibly, precaution means cutting fossil fuel dependence quickly, examining damaging possibilities beyond a central forecast, maintaining essential services during the transition, and preparing for consequences that can no longer be avoided. It does not turn an uncertain catastrophe into a guaranteed prediction.
A responsible plan needs safety margins. It should not depend on every government cooperating perfectly, every new technology arriving on time, and every natural system behaving at the gentlest end of its possible range. Humanity has many talents. Meeting every deadline has not been our signature party trick.
Separate evidence list 1: six decades of warnings and a persistent global shortfall
The record supports a strong conclusion: knowledge and promises have repeatedly failed to produce an adequate global response. The early entries below document warnings, not missed modern treaty targets. The later entries document quantified gaps and observed outcomes. This distinction matters.
- 1965—The warning reached the White House. President Lyndon Johnson’s public response to a scientific advisory report identified the accumulation of CO₂ from coal, oil and gas. This is direct evidence that the issue had reached national leadership more than 60 years ago; it does not mean today’s detailed forecasts were already available. [22]
- 1979—International scientific attention was established. The First World Climate Conference discussed human-caused climate change. The warning was no longer confined to a few isolated researchers. [23]
- 1990–1992—Assessment became an international responsibility. The first IPCC assessment and the climate convention established a scientific and political framework. The convention’s precautionary principle shows that uncertainty was explicitly anticipated, not a newly discovered excuse. [24, 25]
- 2010—The emissions gap was already being quantified. UNEP’s first Emissions Gap Report compared promises with pathways for limiting warming. The existence of this gap is a long-running finding, not a surprise discovered in 2026. [27]
- 2019—UNEP called for a decade of steep cuts. Its contemporary 1.5°C benchmark required average global greenhouse-gas reductions of 7.6% annually during 2020–2030. That sustained decline did not follow. This is a historical benchmark with its own assumptions, not a new target to mix with later baselines. [28, 2]
- 2020—A disruptive emissions dip did not become a durable transition. UNEP warned that the pandemic-related CO₂ decline had not put the world on a Paris-aligned trajectory. Emergency economic shutdown is not a substitute for replacing the systems that create emissions. [29]
- 2024—Pledges remained inadequate. UNFCCC’s synthesis compared national commitments with much steeper AR6 pathways. A country can be implementing a pledge while its pledge remains too weak for the shared climate objective. [30]
- 2025 production plans—Governments were planning the wrong direction. The Production Gap Report estimated planned 2030 fossil production at more than 120% above its median 1.5°C-consistent pathway and 77% above its 2°C pathway. These are pathway comparisons, not probabilities of disaster. [4]
- 2025 observed energy emissions—Another record. The IEA’s 2026 assessment put energy-related CO₂ at nearly 38.4 billion tonnes in 2025, up about 0.4%. Slower growth is welcome, but a growing annual total is still not the sustained decline required. [2]
- 2025 methane—A readily available opportunity was still being missed. The IEA found no sign of a global decline in methane from fossil operations, despite established ways to reduce it. [3]
- October 2026—The latest UNEP comparison still shows a major gap. See the table below. [1]
What this record means: We should not assume that another promise will produce the necessary transformation. We need delivered cuts, functioning replacements, accountable institutions and protection for vulnerable people. Past failure is evidence of powerful barriers. It is not proof that future action has no effect.
 The global gap remains large. UNEP’s lowest possible 1.5°C overshoot pathway calls for much steeper greenhouse-gas cuts than full national pledges deliver. Both use 2025 as the baseline.” Source: bibliography reference 1. This is a comparison of greenhouse-gas emissions, not a graph of fossil fuel use.
The current gap: compare like with like
UNEP’s October 2026 pathway seeks the lowest possible 1.5°C overshoot, peaking around 1.7–1.8°C near mid-century. Its figures compare all greenhouse gases with 2025 levels, not fossil fuel use alone. [1]
| Year | Pathway reduction | Pledged reduction |
|---|---|---|
| 2030 | 18% | 5–8% |
| 2035 | 45% | 11–15% |
| 2040 | 69% | Not specified here |
Current policies imply about 2.8°C this century; full pledges imply about 2.6°C. These are conditional projections, not fixed destinies. Returning to 1.5°C also requires substantial durable CO₂ removal. [1]
A useful target must state its gas coverage, baseline, deadline, accounting rules, and reliance on removals. A reduction in emissions per dollar of economic output can coexist with rising total emissions. A territorial emissions decline can coexist with imported emissions. An increase in clean electricity can coexist with increased oil use. Our scorecard must track the whole outcome.
The practical goal is to replace fossil fuel services fast enough to cut absolute emissions, while safeguarding food, water, health, housing and social stability. No emissions pathway can guarantee safety for every person or prevent every tipping event.
Job One’s conditional 20–30% IPCC underestimation adjustment
Job One for Humanity’s current position is to use a 20–30% precautionary adjustment under specified conditions when planning for selected climate consequences, future additional warming and time-frame urgency. It reflects concerns about interacting risks, incomplete modeling, optimistic delivery assumptions and conservative communication. This is an organizational risk-assessment position; the numerical range is not a universally established error in every IPCC result. [42]
Application must identify the consequence, location, period, baseline and emissions scenario. For selected temperature stress tests, the adjustment applies to future additional warming, with the observed starting temperature held fixed. The linked calculation page explains why this differs from increasing today’s measured warming by the same percentage. [43]
Temperature stress-test rule: adjusted future temperature anomaly = observed starting anomaly + (1.20 to 1.30) × the selected projection’s future warming increment. This is a defined sensitivity test, not a replacement for evaluating the underlying assumptions.
Consequence severity and arrival times need their own analysis. Do not automatically increase deaths, crop losses or sea-level rise by 20–30%, or shorten every timeline by that percentage. Such outcomes have different relationships to temperature, exposure, vulnerability and adaptation. Relevant hazards should be assessed individually and together.
The purpose is to prepare earlier and test whether a plan remains useful under a more damaging outcome. A safety margin should be explicit enough to question, update and improve. Hope benefits from preparation; it does not require pretending that the central forecast is a promise.
The carbon-removal gamble: borrowing a solution from future generations
A climate plan can become dangerously reassuring if it credits enormous future CO₂ removal before the capacity to deliver it exists at the required scale. Some modeled pathways use removals later in the century to compensate for residual emissions or temperature overshoot. Economic optimization can also let those assumed removals substitute for cuts that would otherwise be required sooner. This is a documented problem known as mitigation deterrence. [39, 40]
The IPCC’s 2018 assessment included approximately 100–1,000 billion tonnes of cumulative CO₂ removal over the century in its assessed 1.5°C pathways with limited or no overshoot. This includes land-based approaches as well as technological removal. It illustrates the scale of the assumption, rather than a fixed requirement for every subsequent pathway. [48]
Hansen and colleagues’ 2017 assessment warned that continued high emissions could impose a massive extraction burden on young people. It cited scenario-dependent technological extraction costs of $89–535 trillion over the century, together with major risks and uncertain feasibility. These are historical estimates under that study’s assumptions, not a current price quotation for every removal method. [38]
The difficult questions include energy demand, land and water use, financing, construction rates, transport and storage infrastructure, durability, ecological effects and honest lifecycle accounting. Carbon captured to make a short-lived fuel is not equivalent to durable atmospheric removal. Capturing a plant’s emissions is also different from cleaning up CO₂ already in the air. [12]
Our precautionary position: require rapid cuts in gross fossil emissions, examine plans with tightly constrained future removal, and count verified durable removal when it is delivered. Continued research and targeted deployment do not justify treating an uncertain future cleanup as permission to pollute now.
These assumptions warrant scrutiny for political and commercial influence. Establishing that a particular assumption was inserted at an industry’s direction requires specific evidence. The documented substitution mechanism is already sufficient reason to demand stronger safeguards. The atmosphere, regrettably, does not accept an IOU from a technology that has not been built.
Separate evidence list 2: when humanity has met meaningful targets
Under identifiable conditions, people can do this—and have done it. Here are documented targets achieved at regional or national scale. These are meaningful accomplishments; none amounts to the whole world having solved climate change.
| Place and date | Target and recorded outcome | Useful lesson |
|---|---|---|
| UK, 2008–2022 | The first three statutory carbon budgets were met. For 2018–2022, the net carbon account was about 15% below its permitted cap. [31] | Put successive emissions budgets into law and publish accountable results. |
| EU, 2020 | The bloc exceeded its target of a 20% gross greenhouse-gas reduction from 1990; the cited EEA assessment estimated a 31% cut. The pandemic contributed to the final-year decline. [32] | Use a sustained policy framework, while distinguishing structural progress from temporary shocks. |
| California, 2016 | The state reached its 2020 target of returning greenhouse-gas emissions to the 1990 level four years early. [33] | Combine an emissions limit with sector policies and continuing measurement. |
| Ontario, 2014 | The province completed its coal-electricity phaseout. Its government credits the phaseout as the main contributor to meeting its 2014 target of emissions 6% below 1990. [34] | Plan replacement electricity and retire a specific fossil source. Ending coal power is not the same as ending all fossil use. |
These measures use different accounting boundaries. They are not directly comparable percentages of fossil fuel consumption, and they do not erase emissions embodied in imports or establish that later targets will be met.
Additional evidence that policy changes outcomes: A 2024 study evaluated 1,500 policies across 41 countries and identified 63 interventions associated with large emissions reductions. The study supports carefully designed policy combinations; it does not establish that every policy outside those cases had zero benefit. [35]
The hopeful conclusion is practical: clear requirements, credible enforcement, replacement infrastructure, financing and public support can change an emissions trajectory. We are not applying those conditions fast enough worldwide. The following barriers help explain why.
30 barriers, ranked by their effect on a rapid global transition
The order below is an editorial systems assessment, not a measured percentage contribution or a validated prediction model. We prioritize barriers by their reach across emissions, their influence over other barriers, their persistence and the time needed to change them.
How to read the dates: Every action window below is a proposed planning priority as of October 2026. It is not a scientifically established last safe date. Serious consequences are already affecting people. Many barriers can be reduced before they can be fully removed, and progress after a listed window still matters.
If you have limited time: focus first on reasons 1–9, then use the action section. You can return to the rest without abandoning useful work today.
1. Powerful fossil fuel interests obstruct the transition
Businesses and states that depend on fossil revenues have strong incentives to defend existing assets. Political influence, lobbying and misleading communication can weaken rules before the public even sees the final policy. Research comparing ExxonMobil’s internal projections with its public messaging documents an important example of this conflict.
This barrier ranks first because concentrated interests can influence several other barriers at once: targets, subsidies, investment rules and public understanding. A better battery alone cannot correct a captured decision process. [21, 6]
What can change: Require transparent lobbying and funding, enforce disclosure rules, remove conflicts of interest and build political coalitions that can withstand pressure.
Action window: 2026–2028: strengthen disclosure and accountability; maintain them through every election and investment cycle.
2. The economy still lets polluters pass damage costs to everyone else
When a fuel’s price omits much of its damage to health, infrastructure and climate, cleaner alternatives compete against an artificially incomplete price. Public support for fossil activities can reinforce the imbalance. Communities pay through illness, lost property, taxes or reduced services.
The effect operates across millions of investment and purchasing decisions. It rewards delay even when society would benefit from faster change. This is a problem of rules and incentives, not an argument that every business or market must disappear. [13, 15]
What can change: Combine pollution standards, carefully designed pricing, clean investment and household protection. Return support to people who cannot afford the transition.
Action window: 2026–2030: reform incentives and phase changes in with affordable alternatives; review results annually.
3. International agreements cannot automatically force adequate cuts
The Paris system provides reporting, review and a framework for increasing ambition. But its compliance committee does not impose penalties. A government’s domestic politics can still defeat delivery, and a national pledge can remain inadequate even when fully implemented.
This creates a collective-action problem: each government can fear paying first while others delay. It weakens confidence that sacrifice will be shared and that competitors will face comparable requirements. [26, 14]
What can change: Strengthen transparent verification, domestic legal duties, dependable finance and cooperative sector agreements with credible accountability.
Action window: 2026–2030: improve delivery through existing institutions now. Building stronger cooperation must continue beyond 2030.
4. Global responsibility is fragmented across institutions
Energy, transport, food, finance and trade decisions interact, but different institutions govern them. No single authority can reliably coordinate all national actions and enforce a globally sufficient transition. Responsibility can disappear between agencies even within one country.
This differs from the treaty-enforcement problem: it is also about management, coordination and assigned ownership of tasks. An international promise can lack a funded domestic department capable of delivering it. [13, 14]
What can change: Assign named delivery responsibilities, publish sector milestones, coordinate across government levels and strengthen international institutions with democratic accountability.
Action window: 2026–2028: establish clear delivery structures; 2028–2035: deepen cooperation. Useful action need not await a new world government.
5. Targets and actual delivery remain far apart
Weak near-term requirements can hide behind distant net-zero promises. Accounting that relies heavily on offsets or optimistic future removals can make a plan appear more complete than its physical delivery warrants. Both the strength of targets and the scale of actual reductions matter.
The atmosphere responds to cumulative releases, not the number of conferences announcing intentions. When near-term delivery fails, later budgets become tighter and political promises become harder to keep. [8, 13]
What can change: Publish annual absolute emissions and fossil-use trajectories, identify each accountable agency and fund the measures needed to meet them.
Action window: 2026–2027: reset delivery plans; check outcomes annually through 2030 and 2035. An elapsed deadline cannot be met retroactively.
6. Governments have not mobilized resources at the required scale
Announcing a transition does not build transmission lines, train electricians, fund public transport or lower the financing costs facing poorer countries. Capacity also includes planning staff, procurement systems and institutions able to implement decisions.
This barrier turns theoretically available solutions into projects that remain on paper. High financing costs can make a technically competitive clean technology unaffordable precisely where demand and vulnerability are growing. [15, 16]
What can change: Fund implementation, expand public and private investment, reduce financing barriers and train the workforce alongside infrastructure construction.
Action window: 2026–2030: expand delivery capacity sharply; sustain it through the 2030s and beyond. Lead times make early spending especially important.
7. Political decisions treat short-term economic disruption as a veto
Officials may reject effective measures because they raise a visible cost today, while ignoring the less visible costs of continued warming. They may also favor the industries and regions whose losses are immediate and politically organized.
That comparison is incomplete. Transition costs must be assessed alongside avoided damage, health improvements and the risk of stranded assets. Protecting an economy requires protecting the conditions that let people live and work within it. [9, 15]
What can change: Compare transition and inaction costs honestly, provide support for affected workers and communities, and judge success using health, reliability and long-term welfare as well as output.
Action window: 2026–2028: change appraisal and budgeting rules; maintain support throughout the transition.
8. Essential economic services are deeply dependent on fossil fuels
Factories, heating systems, vehicles and industrial supply chains were built around coal, oil and gas. Abruptly withdrawing those fuels before replacing their services could disrupt employment, production and essential supplies.
That dependency makes a fast transition difficult. It does not establish that rapid, planned decarbonization must cause global economic collapse. The task is to replace the services, reduce waste and sequence retirements intelligently. [11, 9]
What can change: Prioritize essential services, build replacements, retrofit equipment and pair predictable retirement schedules with investment and worker protection.
Action window: 2026–2030: accelerate replacement and avoid new lock-in; 2030–2050: complete difficult industrial changes. Some projects can move much faster.
9. Clean energy must replace fossil energy across whole systems
New solar and wind installations do not automatically retire fossil generation or replace oil in transport and gas in industrial heat. Grids, storage, flexible demand, reliable low-emissions supply and end-use equipment must work together.
The speed of replacement is critical, and clean energy can make a major difference now. The IEA already measures substantial avoided fossil demand from clean technologies. The remaining challenge is scale, integration, and actual displacement. [11, 2]
What can change: Expand clean supply and grids while electrifying uses and retiring fossil equipment; measure the resulting absolute cuts.
Action window: 2026–2030: remove practical bottlenecks and accelerate displacement; continue system conversion through the 2030s and 2040s.

Fossil dependence can support vested interests; weaker rules and incomplete cost accounting can then slow the alternatives that would reduce that dependence. Article reasons: #1, #2, #3, #4, #5, #6, #7, #8, #9, #10, #22.
Loop description:
1. Greater fossil fuel dependence → Stronger defense of fossil interests. Fossil-dependent assets, jobs, and revenues can motivate organized defense of incumbents. [Especially conditional response.]
2. Stronger defense of fossil interests → Weaker climate rules and accountability. Organized interests can influence the ambition, scope and enforcement of policy. [Especially conditional response.]
3. Weaker climate rules and accountability → More unpriced damage and short-term vetoes. Weak rules can leave environmental damage outside producers’ and users’ private costs.
4. More unpriced damage and short-term vetoes → Replacement lags behind demand. Incomplete pollution pricing and short-term cost objections can weaken replacement incentives. [Especially conditional response.]
5. Replacement lags behind demand → Greater fossil fuel dependence. When replacement services lag demand, continued fossil dependence becomes harder to reduce.
This loop is a reinforcing cycle: Greater fossil fuel dependence; then stronger defense of fossil interests; then weaker climate rules and accountability; then more unpriced damage and short-term vetoes; then replacement lags behind demand; the cycle returns to its starting point.
Actions that can weaken it include transparent influence, pollution standards, reliable clean replacement. Ways to weaken the loop: transparent influence, pollution standards, reliable clean replacement. Supporting article bibliography references: 6, 7, 9, 11, 13, 15.
10. Demand growth can outrun efficiency and clean supply
More construction, travel, cooling and industrial production can absorb clean energy gains without reducing total fossil use. Population matters, but consumption patterns, inequality, urban design and the carbon intensity of services matter too.
Blaming people with very low emissions obscures the disproportionate demand of high-consuming groups. The challenge is to improve living standards where needs are unmet while reducing wasteful, high-emission demand elsewhere. [7, 10]
What can change: Improve efficiency, public transport, building design, material use and clean access to essential services. Support education and voluntary reproductive healthcare as human rights.
Action window: 2026–2030: enact efficiency and infrastructure changes; sustain demand improvements through 2050. Demographic change is not a quick emissions remedy.
11. Unfair burdens undermine international cooperation
Countries differ in historical responsibility, current emissions, wealth and vulnerability. Communities that contributed least can face severe losses while lacking affordable capital for safer infrastructure. These inequities affect whether a proposed agreement seems legitimate.
When promised help is unreliable or difficult to obtain, trust erodes. Fairness is therefore part of the practical machinery of cooperation, not decoration added after the engineering is complete. [25, 15]
What can change: Deliver accessible climate finance, technology cooperation, adaptation support and fair processes for loss and damage. Set obligations that reflect responsibility and capacity.
Action window: 2026–2030: improve actual transfers and access, not only pledges; maintain support over decades.
 Fairness and reliable finance are part of effective emissions reduction: inadequate cooperation can perpetuate the conditions that make cooperation difficult. Article reasons: #3, #6, #9, #11, #21, #29
Loop description:
-
- Greater distrust between countries → Larger gaps in international cooperation. Distrust can make states less willing to accept or deliver reciprocal commitments. [Especially conditional response.]
- Larger gaps in international cooperation → Less accessible finance and transition support. Cooperation gaps can reduce predictable finance, technology cooperation and implementation support. [Especially conditional response.]
- Less accessible finance and transition support → Slower clean replacement in underfunded regions. Limited affordable capital and implementation support can constrain clean replacement.
- Slower clean replacement in underfunded regions → Greater unequal harm and disputed burdens. Underinvestment can prolong vulnerability and fossil dependence; distributional results depend on policy and local circumstances. [Especially conditional response.]
- Greater unequal harm and disputed burdens → Greater distrust between countries. Unequal losses and disputed responsibility can undermine trust, especially when support promises go unmet. [Especially conditional response.]
- R5 is a reinforcing cycle: Greater distrust between countries • larger gaps in international cooperation • less accessible finance and transition support • slower clean replacement in underfunded regions • greater unequal harm and disputed burdens • the cycle returns to its starting point. Actions that can weaken it include delivering promised finance, sharing technology, and making responsibilities fair. Ways to weaken the loop: Deliver promised finance; Share technology; Make responsibilities fair. Supporting article bibliography references: 14, 15, 16, 25.
12. Poorly designed policies can trigger public backlash
People may resist climate measures when costs arrive before alternatives, jobs are threatened, or decisions appear unfair. Fuel and electricity price shocks can become immediate political emergencies. Governments then weaken or reverse their commitments.
Backlash is a risk, not proof that every strong climate policy will overthrow a government. The successful examples above show that policy design and durable public support can change the outcome. [10, 13]
What can change: Provide affordable transport and heating options, targeted rebates, worker guarantees, and meaningful public participation before or alongside major price changes.
Action window: 2026–2028: build protection into new policies from the start; maintain a just transition through 2040 and beyond.
13. Food systems need protection during the energy transition
Agriculture depends on energy for fertilizer production, machinery, processing, refrigeration and transport. A chaotic fuel withdrawal could harm food availability and prices, especially for households already facing hunger.
This creates a genuine sequencing challenge: climate damage threatens food systems, and a badly managed transition can also threaten them. Neither is a reason to keep the system permanently dependent on fossil fuels. [17, 11]
What can change: Protect essential food services while improving fertilizer efficiency, reducing losses, diversifying supply and replacing fossil-dependent equipment and inputs where feasible.
Action window: 2026–2030: safeguard vulnerable food supply chains and begin substitutions; 2030–2040: scale resilient, lower-emission production and distribution.

Loop description:
-
- Greater household financial pressure → Greater fear of losing work or security. Households under financial strain may be more concerned about additional costs or disruption. [Especially conditional response.]
- Greater fear of losing work or security → Stronger backlash against climate policy. Fear of losses can translate into opposition when alternatives and compensation are inadequate. [Especially conditional response.]
- Stronger backlash against climate policy → More policy delay and reversal. Backlash can cause policymakers to postpone, reverse or weaken measures. [Especially conditional response.]
- More policy delay and reversal → Greater exposure to fuel shocks and climate costs. Delay in affordable replacement and protective measures can prolong exposure to fuel volatility and climate damage. [Especially conditional response.]
- Greater exposure to fuel shocks and climate costs → Greater household financial pressure. Fuel shocks, lost earnings, and climate damage can increase household financial pressure.
- R2 is a reinforcing cycle: Greater household financial pressure • greater fear of losing work or security • stronger backlash against climate policy • more policy delay and reversal • greater exposure to fuel shocks and climate costs • the cycle returns to its starting point. Actions that can weaken it include affordable alternatives, worker protection, and targeted household support. Ways to weaken the loop: affordable alternatives; worker protection; targeted household support. Supporting article bibliography references: 9, 10, 13, 17.
14. Promised future carbon removal can weaken cuts needed today
A plan that credits massive CO₂ removal around mid-century and later can make continued emissions look more manageable than they are. If that removal substitutes for earlier cuts and then fails to arrive, the resulting pollution and warming remain with future generations.
This is a delivery, scale, and intergenerational-risk problem. Existing capture equipment does not demonstrate that the required global removal infrastructure will be affordable, durable, or available on time. The carbon-removal section explains the research and the distinction between avoiding emissions and removing atmospheric CO₂. [12, 38, 39, 40]
What can change: Cut gross fossil emissions rapidly, keep removal accounts separate, constrain speculative assumptions, and independently verify actual net removal and storage durability.
Action window: 2026–2030: prevent future cleanup promises from weakening immediate cuts; scrutinize deployment and residual needs through mid-century and afterward.
 Loop description:
-
- More reliance on future carbon removal → Weaker near-term requirements. Modeling and policy can allow anticipated later removal to substitute for earlier emissions reductions.
- Weaker near-term requirements → More cumulative greenhouse pollution. A weaker requirement, if followed, permits more emissions than a stronger one under otherwise similar conditions.
- More cumulative greenhouse pollution → A larger future cleanup burden. Greater cumulative CO₂ pollution raises the removal burden for an otherwise comparable lower-temperature objective.
- A larger future cleanup burden → More pressure to promise a future technical rescue. A larger cleanup burden can increase political pressure to rely on future technical delivery; it can also motivate stronger cuts instead. [Especially conditional response.]
- More pressure to promise a future technical rescue → More reliance on future carbon removal. Repeated promises can reinforce reliance if they continue to be credited in plans without adequate delivery safeguards. [Especially conditional response.]
- R3 is a reinforcing cycle: More reliance on future carbon removal • weaker near-term requirements • more cumulative greenhouse pollution • a larger future cleanup burden • more pressure to promise a future technical rescue • the cycle returns to its starting point. Actions that can weaken it include: cut gross emissions now, Separate removal accounts, verify durable storage. Ways to weaken the loop: Cut gross emissions now; Separate removal accounts; Verify durable storage. Supporting article bibliography references: 8, 12, 38, 39, 40.
15. Decades of delay have made the remaining task harder
Earlier action could have spread investment and equipment replacement over more years. Continued emissions consumed part of the remaining room for limiting warming. Today’s plans must work within a more difficult starting position.
The lost time cannot be recovered. But a difficult task can become harder still if governments use earlier failure as a reason to postpone it again. History raises the standard of evidence required for promises; it does not make useful action futile. [8, 22, 25]
What can change: Start with measures that can deliver quickly while building the institutions and infrastructure needed for sustained change.
Action window: The historical loss is permanent. The remaining response begins in 2026 and must strengthen each year; there is no benefit to another waiting period.
16. Risk planning can miss danger: Job One’s conditional 20–30% adjustment
Central forecasts can become fragile planning assumptions when consequential risks are weakly integrated or when delivery depends on optimistic policy and technology assumptions. Several interacting limitations can make practical urgency greater than a central estimate suggests.
Job One uses a conditional 20–30% precautionary planning adjustment for specified applications. The dedicated section explains its limits and method. It is a risk-assessment position to test against evidence, not a blanket multiplier for every IPCC number. [18, 42, 43]
What can change: State assumptions, run defined stress tests, assess interacting risks and revise the adjustment as observations and research improve.
Action window: 2026–2027: apply transparent risk review to current decisions; update continuously.
17. Methane adds a powerful near-term warming problem
Leaks, venting and other fossil operations add methane alongside CO₂. Permafrost and wetlands also influence natural methane and carbon flows, requiring different responses from repairing a pipeline.
Methane reductions can slow near-term warming, yet the IEA finds global fossil-sector progress inadequate. Cutting CO₂ while neglecting methane sacrifices an important opportunity. Natural feedbacks add concern, but do not justify a fixed prediction of an imminent global methane explosion. [3, 19]
What can change: Measure and repair leaks, limit routine venting and flaring, require operational standards and reduce fossil throughput. Protect ecosystems as part of the wider response.
Action window: 2026–2030: prioritize controllable industrial releases now; monitor natural feedbacks over the following decades.
18. The Climageddon Feedback Loop can amplify interacting risks
Job One’s Climageddon Feedback Loop (CFL) examines how feedbacks, tipping points, nonlinear responses and human-system disruptions can interact. A danger assessed in isolation can become more consequential when it changes the conditions affecting another system.
Peer-reviewed conceptual network modeling supports examining destabilizing interactions among tipping elements. The complete CFL is an additional organizational systems-risk framework, not an independently calibrated global forecast. Physical interactions can reduce the margin for delay; social damage can also weaken the capacity to respond. [19, 41, 44]
What can change: Reduce warming rapidly, protect vulnerable ecosystems and essential services, monitor interacting risks and plan for compound disruptions.
Action window: 2026 onward: address interacting risks now. Exact universal thresholds and crossing dates for the complete CFL are not established.
19. Long-lived ice and ecosystem changes could greatly extend the damage
Later, cascading dangers can involve ice loss and additional greenhouse-gas releases. The underlying concern is that a short period of delayed action could leave future generations managing changes over much longer periods.
Individual tipping elements have different threshold ranges and response times. A threshold crossing can commit a system to change without the full change appearing immediately. This is especially important for long-lived ice and sea-level consequences. [19, 5]
What can change: Limit peak warming and its duration, protect ecosystems and make long-term coastal decisions that account for persistent change.
Action window: 2026–2035: reduce additional commitments urgently; adaptation and monitoring must continue through 2100 and beyond. Exact element-specific deadlines remain uncertain.
20. Dangerous warming already coexists with inadequate control
The climate system is already altered, serious losses have begun, and the global response remains inadequate. Hansen’s early danger-zone warning explains why waiting for a later, perfectly identifiable cliff is unsafe.
Job One uses runaway global warming as an operational term for an inadequately controlled emissions and governance trajectory. It does not mean the technical planetary runaway greenhouse, nor that emissions cuts have lost their influence. This definition allows us to name the failure of control while continuing to act. [5, 37, 41]
What can change: Reduce emissions and update local risk planning for today’s hazards while preventing additional commitments to future harm.
Action window: Some losses have already occurred. Begin or strengthen action in 2026 and sustain it; preventing additional damage remains useful throughout the century.
21. Other crises compete for resources and can weaken delivery
War, debt, financial stress, biodiversity loss, public-health emergencies and political instability can divert money and administrative attention. Climate damage can then worsen those same problems.
This creates a reinforcing social loop: crisis weakens the ability to invest in prevention, leaving systems more exposed to the next crisis. Treating climate policy as a separate optional project can make it vulnerable whenever another emergency arrives. [18, 16]
What can change: Connect clean energy, resilient infrastructure and adaptation with food security, public health, reduced import dependence and reliable essential services.
Action window: 2026–2030: integrate budgets and emergency planning; maintain institutions that can function through shocks in the 2030s and beyond.
22. Political and infrastructure inertia keep yesterday’s choices operating
Past decisions survive in power plants, road networks, buildings, investment contracts and administrative procedures. Changing a law does not instantly replace those systems. Human routines and institutional habits can add delay.
Physical climate persistence is a different issue: some ocean and ice changes continue over very long periods. Confusing that persistence with inevitable endless surface warming after net-zero CO₂ can wrongly suggest that mitigation has lost its value. [7, 20]
What can change: Avoid new high-emission lock-in, shorten replacement cycles where feasible and improve planning and procurement while preparing for persistent physical effects.
Action window: 2026–2030: stop deepening lock-in; 2030–2050: replace remaining systems. Long-lived climate consequences require much longer stewardship.
23. People can normalize a threat that develops over time
A familiar daily routine can make an accumulating global risk feel distant. People may adjust their sense of what is normal as heat, smoke or repeated disruptions become more common. Long-term probabilities compete with immediate experience.
This tendency is a barrier, not a universal inability to learn. Clear local information, trusted messengers and practical choices can make a complex risk more understandable and actionable. [10, 13]
What can change: Connect risks to health, food, water and household costs; show trends alongside specific actions and visible results.
Action window: 2026–2028: improve local communication and preparedness; reinforce it continuously as conditions change.
24. Daily survival and media distraction leave little room for collective action
Someone struggling with rent, caregiving or unsafe work may have little time to evaluate climate policy or attend a public meeting. Information overload can further crowd out attention.
A movement that demands unlimited unpaid time from exhausted people will exclude many of those most affected. Individual concern does not automatically become organized political capacity. [10, 16]
What can change: Make participation accessible, provide understandable information, improve material security and build organizations that share the workload.
Action window: 2026–2030: reduce practical barriers to participation and connect climate improvements to everyday needs; sustain support afterward.
25. Fear of change can be stronger than confidence in a better system
Workers and communities may understand climate risks while reasonably fearing the loss of income, identity or local services. Firms and fossil-exporting states can also fear losing valuable assets and revenues.
This overlaps with backlash but focuses on anticipation: fear can stop a policy before implementation begins. A credible replacement opportunity is more persuasive than a distant promise that everything will eventually work out. [9, 10]
What can change: Negotiate worker transitions, support local revenue replacement and involve affected communities in the design of new industries and services.
Action window: 2026–2030: establish funded transition agreements before major closures; continue support through the 2040s where needed.
26. Public concern has not consistently become durable political power
Climate movements have achieved real influence, yet pressure is uneven and can fade between disasters or elections. Citizens may lack access to decision-makers, face repression or be divided over policy design.
It is unfair to say that people simply did not care. The practical problem is how to turn concern into organized, persistent influence over laws, budgets and implementation. [13, 16]
What can change: Build broad coalitions among workers, health professionals, communities, businesses and younger and older generations; track delivery between elections.
Action window: 2026 onward: organize continuously, with measurable goals in each budget and election cycle. Progress remains possible even under difficult national politics.
27. We have accepted risks that endanger future generations
Present decisions can impose costs on people who cannot vote today. The benefits of continued pollution can be concentrated now, while future losses are widespread and difficult to reverse.
This is a failure of acceptable-risk standards and representation. It is not a scientific claim that one universally agreed extinction boundary has already been crossed. Severe risks warrant stronger protection even when an exact catastrophic probability cannot be calculated. [25, 18]
What can change: Use precautionary safeguards, independent scrutiny and long-term public-interest tests for major investment and policy decisions.
Action window: 2026–2028: strengthen decision standards now; apply them to every subsequent planning cycle.
28. Distrust and polarization can defeat emergency cooperation
The pandemic showed that public-health action can be weakened by distrust, politicization and unequal burdens. It also showed that large-scale cooperation and rapid innovation are possible.
The lesson for climate policy is not that people always reject life-saving change. Trust and legitimacy must be built before and during an emergency. Commands unsupported by credible institutions or practical help can provoke resistance. [10, 13]
What can change: Use trusted messengers, transparent evidence, consistent rules and fair support. Correct errors openly and give people meaningful participation.
Action window: 2026–2028: strengthen trust and participation; maintain both over decades. This is a qualitative comparison, not a numerical forecast from pandemic behavior.
29. Humanity has not built a shared, durable mobilization
Climate protection asks societies to cooperate across borders and generations without a single universally accepted command structure or common political identity. Rivalry can turn shared security into an argument over who moves first.
Waiting for one overwhelming event to unite the world is dangerous. A disaster can also deepen conflict and consume the resources needed to respond. Cooperation must be constructed through useful shared projects. [14, 16]
What can change: Build commitments around dependable energy, healthier air, protected livelihoods and a livable future; connect national efforts through reciprocal agreements.
Action window: 2026–2030: build practical coalitions now and widen them through the 2030s. Complete global unanimity is not a prerequisite for progress.
30. Complexity is poorly explained and systems literacy is uneven
Climate change connects physical science, economics, infrastructure and collective behavior. Poor explanations, fragmented education and misleading claims make those connections hard to follow.
Understanding climate danger depends on more than a test score. Clear teaching, suitable formats and trustworthy institutions can widen understanding. People should be invited into the solution, not dismissed as intellectually unfit. [10, 13]
What can change: Teach the key relationships in plain language, use accessible diagrams, and let readers verify claims and ask questions.
Action window: 2026–2028: improve public materials and decision-maker training immediately; strengthen education throughout the 2030s and beyond.
 Loop description:
- Less accessible climate understanding → More distraction, distrust, and polarization. Inaccessible explanations can increase the difficulty of resolving confusing or polarized claims; they do not determine beliefs alone. [Especially conditional response.]
- More distraction, distrust, and polarization → Weaker organized public pressure. Distraction and distrust can make sustained, coordinated participation harder. [Especially conditional response.]
- Weaker organized public pressure → Weaker public accountability. Weak organized participation can reduce scrutiny of decisions and implementation. [Especially conditional response.]
- Weaker public accountability → More room for misleading reassurance. Weak accountability can create more room for unsupported reassurance or misleading communication. [Especially conditional response.]
- More room for misleading reassurance → Less accessible climate understanding. Misleading claims can make the key relationships and practical choices less accessible. [Especially conditional response.]
- R4 is a reinforcing cycle: less accessible climate understanding • more distraction, distrust, and polarization • weaker organized public pressure • weaker public accountability • more room for misleading reassurance • the cycle returns to its starting point. Actions that can weaken it include Clear explanations, Trusted messengers, and sustained civic organization. Ways to weaken the loop: clear explanations; trusted messengers; sustained civic organization. Supporting article bibliography references: 10, 13, 16, 21.
The Climageddon Feedback Loop: why separate problems can become a larger danger
The Climageddon Feedback Loop is Job One’s systems-risk framework for examining interacting tipping elements, amplifying feedbacks, nonlinear changes, and human cascades. It asks how combined risks might develop faster or more disruptively than isolated assessments suggest. [41]
For example, warming can stress forests and weaken carbon uptake; the resulting carbon-cycle change can contribute to further warming. Heat and drought can also damage food and water systems, adding pressure to health services, public finances and governments. Weaker institutions may then struggle to fund prevention and emissions reduction. These links have different levels of evidence and depend on local and global conditions. [18, 44]

Climate damage can strain institutions and budgets, slowing prevention and increasing later risks. This pathway is conditional: well-designed recovery and external support can weaken it. Article reasons: #5, #6, #9, #13, #17, #18, #19, #20, #21, #22
Loop description:
- Greater climate hazards and interacting risks → More damage to food, health and infrastructure. Greater hazards can increase damage where people and systems are exposed and vulnerable.
- More damage to food, health and infrastructure → More emergency demands on budgets and institutions. Damage creates additional needs for relief, rebuilding and essential-service restoration.
- More emergency demands on budgets and institutions → Less capacity for long-term prevention. Unfunded recovery demands can crowd out prevention; well-funded recovery can instead improve resilience. [Especially conditional response.]
- Less capacity for long-term prevention → Slower emissions cuts and resilient replacement. Strained capacity can delay emissions reduction, clean replacement and resilience work. [Especially conditional response.]
- Slower emissions cuts and resilient replacement → Greater climate hazards and interacting risks. Slower global mitigation adds to warming risk over time; delayed resilient replacement also increases future vulnerability.
- R6 is a reinforcing cycle: Greater climate hazards and interacting risks; then More damage to food, health, and infrastructure; then More emergency demands on budgets and institutions; then Less capacity for long-term prevention; then Slower emissions cuts and resilient replacement; the cycle returns to its starting point. Actions that can weaken it include: Protect prevention budgets, Build resilient services, Cut emissions during recovery. Ways to weaken the loop: Protect prevention budgets; Build resilient services; Cut emissions during recovery. Supporting article bibliography references: 5, 17, 18, 41, 44.
Wunderling and colleagues’ 2021 conceptual network study found that interactions can increase tipping-cascade risk. It supports examining connections, but does not validate every proposed CFL link or supply a date for a complete global cascade. [44]
Evidence and interpretation belong together: established physical mechanisms support concern; the complete master-loop proposition remains an organizational framework to investigate and stress-test. Precaution means planning for plausible interactions while keeping their uncertainties visible.
Here, runaway follows Job One’s operational definition: pollution and warming remain inadequately controlled, and current governance has not demonstrated sufficient delivery. The physical consequences remain affected by our choices. Clear definitions allow urgency and useful action to coexist.
Why the barriers feel overwhelming—and where action can multiply
These problems do not add up like 30 independent weights. They interact. Fossil dependence can create political influence; that influence can weaken policy; weak policy can prolong fossil dependence. High household costs can fuel backlash, which can weaken investment and keep cleaner alternatives expensive.
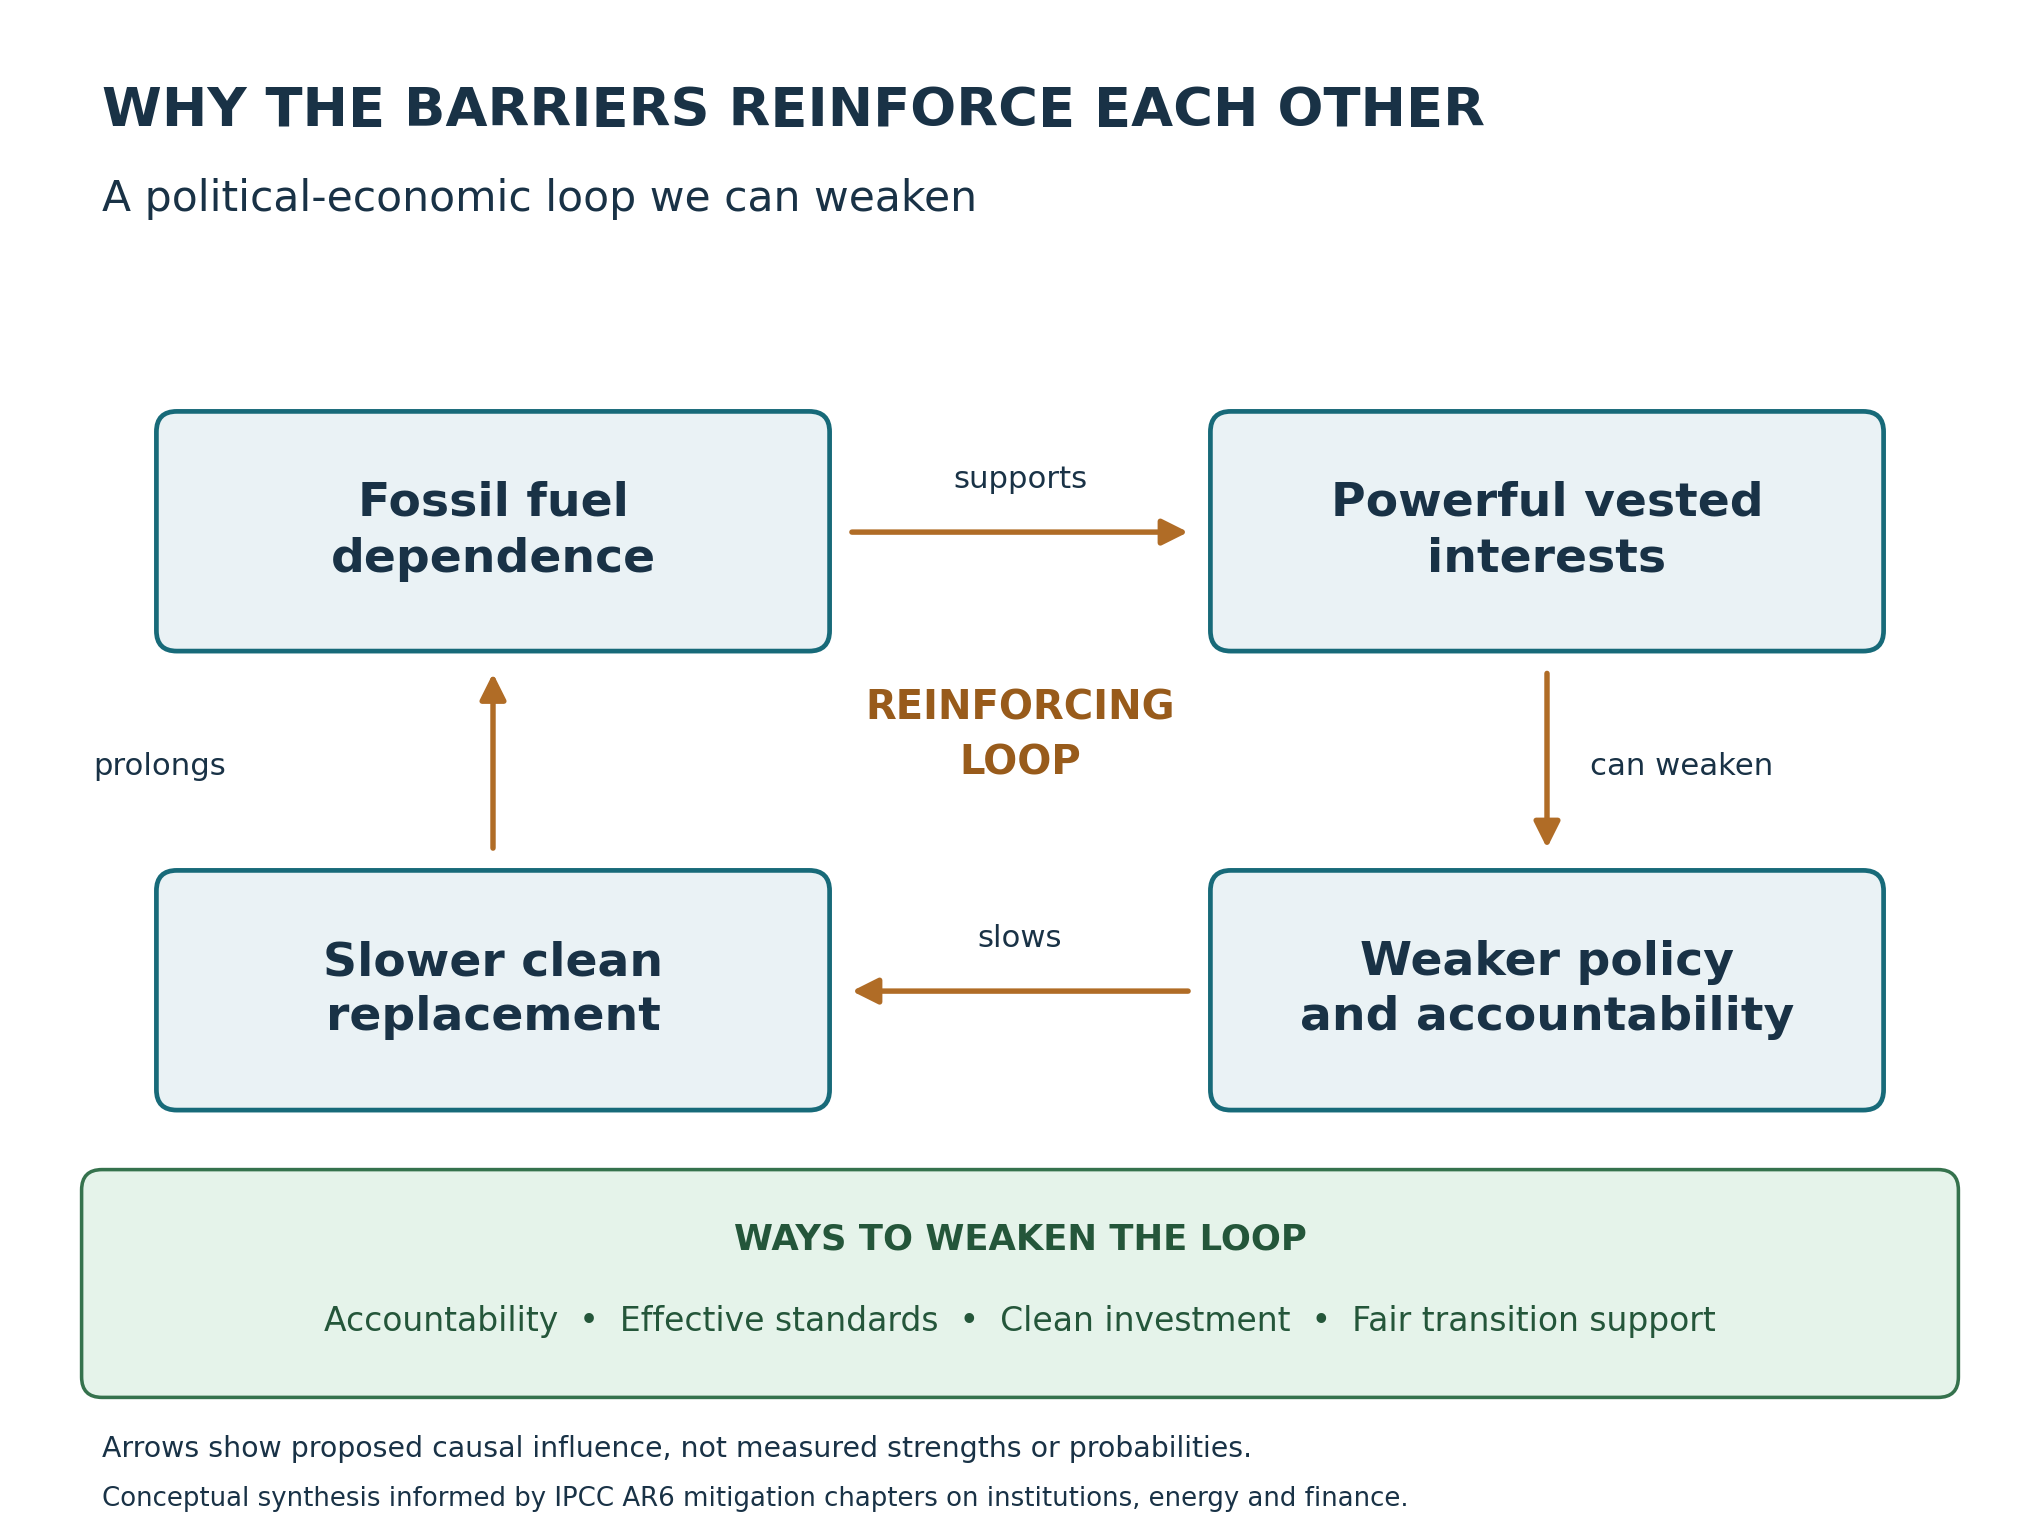
(“Fossil dependence supports vested interests, which weaken policy, which slows clean replacement and prolongs fossil dependence. Accountability, effective standards, investment and fair transition support can weaken these links.” Sources: conceptual synthesis informed by references 6, 7, 11, 13, 15 and 16.)
That creates danger, but also opportunities. A reliable, affordable clean transport or heating option can reduce emissions, lower household exposure to fuel shocks, and make stronger policy more acceptable. A funded worker transition can weaken both economic fear and political resistance.
This is our systems interpretation of the evidence, not a calculated forecast. The practical lesson is to seek changes that weaken several barriers together. We do not have to solve every disagreement before reducing a large source of emissions.
Think of a badly tangled extension cord. Thirty knots are discouraging. But loosening the right few can free a surprising amount of cable. The climate version requires fewer heroic speeches and rather more competent electricians.
The human cost: a conditional 2050–2070 risk scenario
Job One for Humanity’s conditional risk assessment is that hundreds of millions of people, up to as many as 1 billion, could die between 2050 and 2070 if global fossil fuel use continues on its present inadequate reduction trajectory. The proposed range concerns cumulative premature deaths from direct and indirect climate primary and secondary consequences across that period, rather than an annual death toll.
Status of this number: this is the organization’s precautionary high-impact scenario. The cited evidence does not independently establish this range specifically for 2050–2070, and this article does not provide a validated, cause-by-cause global calculation. The number is neither a certainty nor a demonstrated upper bound on every possible outcome.
The concern includes the primary and secondary consequences described by Job One: direct exposure to dangerous heat and disasters; disruptions to food, water and health services; and possible cascading effects involving livelihoods, displacement, governance and conflict. Those pathways interact, and their mortality effects cannot be added as independent totals. [18, 47]
| Evidence | Useful finding | Limit for this scenario |
|---|---|---|
| WHO, 2014 assessment | Projected about 250,000 additional deaths annually during 2030–2050 from a selected subset of causes under its assumptions. [45] | A partial assessment, not a complete ceiling on climate mortality and not a forecast for 2050–2070. |
| Pearce and Parncutt, 2023 | Discussed an order-of-magnitude estimate of roughly one billion premature deaths over approximately a century associated with warming around 2°C. [46] | The very broad method and much longer time horizon do not validate placing that total inside 2050–2070. Job One predicts that a 2°C warming will occur long before 2100. |
| Job One’s proposed scenario | Raises concern about compounded direct and indirect deaths if inadequate fossil reductions continue. | Requires an explicit emissions and socioeconomic scenario, attribution rules, and adaptation assumptions. |
A person who dies after drought causes hunger, displacement and illness is one death with interacting causes—not three deaths. A defensible total must compare outcomes with an appropriate no-additional-climate-change baseline, account for overlapping pathways and avoid attributing all deaths during a future crisis to climate change.
These are preventable-risk questions, not an invitation to surrender. The mortality burden will depend on emissions, exposure, public health, food access, adaptation and cooperation. Reducing those risks is valuable regardless of whether this particular numerical scenario is ultimately supported.
What are humanity’s chances? A candid forecast without invented precision
Our forecast: With today’s policies, institutional weaknesses and investment patterns, a sufficiently fast, coordinated transition to minimize dangerous warming appears unlikely. Further serious climate damage is likely. It is also likely that stronger action would prevent substantial additional harm compared with continued delay. This is a qualitative judgment, not a probability calculated from the ranked list.
“Resolving the nightmare” contains several different outcomes. Preventing every major loss, limiting peak warming, returning to a lower temperature, and protecting social stability are not the same event. A single percentage would conceal these differences.
| Outcome | Assessment |
|---|---|
| Meet the previously proposed fossil fuel reduction 2025 deadline | The deadline has passed. The proposed transformation was not achieved; it cannot be accomplished retroactively. |
| Avoid serious climate consequences altogether | That opportunity has already been lost: serious consequences are occurring. |
| Return to or below 1.5°C by 2100 | UNEP gives about a 50% chance conditional on delivering its specified pathway. This is not a 50% chance that governments will deliver it. [1] Job one forecasts 1.5°C will be crossed in about the next 15 years. |
| Deliver the needed global political and economic transformation | No scientifically defensible single percentage is established by these sources. Assigning one would be unsupported precision. |
| Maintain humanity’s stability | No single emissions target guarantees stability. Outcomes also depend on inequality, institutions, conflict, adaptation, and protection of essential services. |
What would make this assessment more hopeful? A sustained global decline in absolute emissions and fossil demand; much faster clean replacement; fewer methane releases; finance actually delivered; and strong policies surviving changes of government. Several years of those results would be more persuasive than another collection of distant promises.
The future is not a pass-or-fail examination with only two grades: paradise or extinction. Avoiding additional warming and reducing exposure can mean fewer dangerous heat events, less damage, safer livelihoods and more room for future generations to recover.
Put hope to work: begin the Job One for Humanity Plan B
Plan B means acting on two responsibilities together: reduce the causes of future harm and protect people from consequences already unfolding. Preparing does not require giving up on mitigation. Working for mitigation does not require pretending that preparation can wait.
- Protect people now. Review local heat, smoke, flood, water and power risks. Build practical emergency arrangements, especially for people who need help with health, mobility, housing or transport.
- Reduce vulnerability. Strengthen home and community resilience. Assess major purchases and investments against local risks and realistic resources.
- Push for changes at scale. Support effective government action, clean infrastructure, methane controls, fair financing and accountable implementation. Combine personal changes with collective influence.
- Work with other people. A neighborhood, professional association, workplace or community organization can sustain useful work better than an isolated person trying to solve everything.
For structured next steps, go to the Job One for Humanity Climate Change Solutions and Resilience Plan B. Choose an entry point that fits your circumstances and ability to act. Its preparation, adaptation, and government-action resources can be used together. [36]
Give yourself permission to work steadily, enjoy life and rest. Exhaustion is not an emissions-reduction strategy. Protecting the future is a long project, and the team is allowed a lunch break.
Evidence standards
Established findings are grounded here in scientific assessments, published research and official emissions or target records. Emerging research, including work on tipping interactions, informs risk assessment without supplying exact universal deadlines. Our analysis includes the priority order, action windows and qualitative outlook. Precautionary recommendations explain how to act responsibly under uncertainty.
Scientific sources establish physical risks and observed trends. The 20–30% adjustment, the full CFL framework and the proposed 2050–2070 mortality range are identified as organizational assessments with different levels of supporting evidence. The exact mortality range and window are not independently established here. Scientific sources do not independently validate every political interpretation or editorial ranking in this article. The numbered references let readers check the evidence supporting each discussion.
Conclusion: protect the future that is still within reach
The central facts are difficult: warnings have reached leaders for decades, Hansen argued that CO₂ was already dangerously high in 2008, the global response remains inadequate, and some climate losses will last for generations. Thirty interacting barriers help explain why. Denying those barriers makes them harder to change.
The CFL framework, Job One’s conditional 20–30% planning adjustment, and the risk of relying on future carbon removal all point toward earlier preparation and stronger near-term action. The human-cost scenario should motivate prevention while remaining clearly distinguished from a validated death forecast.
The successes matter just as much. Regions have retired major fossil sources, met emissions targets, and built institutions that deliver measurable reductions. Their example supplies conditions to reproduce, not a reason to relax.
The conclusion that follows is this: we must become more serious about both the obstacles and the opportunities. Every useful reduction protects part of the future. Every well-designed adaptation can reduce someone’s suffering. Neither requires a guarantee that everyone else will cooperate.
We cannot promise our descendants a world untouched by our mistakes. We can still work to leave them a world with less damage, stronger communities and more choices. That is a future worth showing up for.
Humanity has already demonstrated remarkable powers of delay. Let us now explore the less familiar hobby of following through. Start with one practical step in the Job One for Humanity Plan B, and invite someone to take it with you. Hope becomes sturdier when it has a job.
Frequently asked questions
Is climate change already irreversible?
Some changes and losses are irreversible on human timescales. That does not mean all additional warming and damage are unavoidable. Future emissions still strongly affect outcomes. [5, 20]
How should readers understand the 2050–2070 mortality range?
The range of hundreds of millions up to one billion is Job One’s conditional high-impact scenario for cumulative premature deaths during that period. The sources cited here do not independently validate its total or timing. The human-cost section explains the evidence and the need to avoid double counting. Stronger mitigation and protection can reduce mortality.
Does passing 1.5°C mean further reductions no longer matter?
No. Additional warming increases risks. Reducing the height and duration of overshoot still matters, and lower warming is generally less dangerous than higher warming. [5]
Why not rely on future carbon removal?
Crediting large future removals can substitute for cuts today. If the promised removal fails, future generations inherit the extra pollution. Some technologies operate, but global deployment at assumed scale, cost and durability remains a separate challenge. Prioritize gross emissions cuts and verify actual durable removals. [39, 40]
Should we immediately switch off all fossil fuel supplies?
A planned rapid transition must protect food, water, health and energy services. Replace fossil-dependent services and reduce waste while retiring the fuels. Unmanaged withdrawal can harm vulnerable people. [11, 17]
Have climate policies ever worked?
Yes. The separate success list includes documented target achievements in the UK, EU, California and Ontario. Success in a particular jurisdiction does not establish that the global transition is adequate.
Why are the dates described as action windows?
Research does not establish an exact last safe date for each political, social or technological barrier. The dates identify priorities for action and implementation; they do not announce when a disaster will start.
Is the priority order scientifically proven?
No. It is a systems-based editorial judgment about scale, influence and persistence. Several entries overlap, so their contributions should not be added or treated as independent probabilities.
Why give no single percentage for humanity’s success?
Political delivery, climate response and social stability are different uncertainties. The available evidence does not supply a defensible combined probability. A candid qualitative forecast is more useful than a precise-looking guess.
Does preparation mean giving up?
No. Preparation reduces vulnerability, while mitigation reduces future hazards. Do both, and support people who cannot protect themselves without help.
What can one person usefully do?
Protect your immediate circle, reduce avoidable emissions where practical, and join efforts that change infrastructure, institutions and policy. Begin with an achievable step in the Job One Plan B.
Does Job One apply a 20–30% correction to every IPCC number?
No. The current position is conditional and application-specific. Selected temperature tests adjust future additional warming while keeping the observed starting point fixed. Consequence severity, mortality and dates require separate analysis. See the method and conditions.
What does “runaway global warming” mean here?
It follows Job One’s operational definition of an inadequately controlled pollution and governance trajectory. It does not mean that every physical outcome is fixed or that reducing emissions has become ineffective. See the CFL explanation.
Glossary
- Absolute emissions
- The total amount emitted, rather than emissions per person, product or dollar.
- Adaptation
- Changes that reduce harm from climate conditions and hazards.
- Carbon budget
- In climate science, cumulative CO₂ compatible with a specified temperature limit and probability; in UK law, also a binding emissions cap for a period. These uses differ.
- Carbon dioxide removal
- Human activities that remove CO₂ from the air and store it durably.
- Carbon lock-in
- Infrastructure, institutions or habits that prolong dependence on high-emission systems.
- CO₂
- Carbon dioxide, a major long-lived greenhouse gas.
- CO₂ equivalent (CO₂e)
- A way to express different greenhouse gases using a stated warming metric and time horizon.
- Concentration
- The amount of a gas in the atmosphere; CO₂ is often measured in parts per million.
- Emissions
- Gases released over a defined time period.
- Fossil fuels
- Coal, oil and natural gas.
- Greenhouse gases (GHGs)
- Gases that trap heat, including CO₂, methane and nitrous oxide.
- IEA
- International Energy Agency.
- IPCC
- Intergovernmental Panel on Climate Change, which assesses published research.
- Irreversible on human timescales
- Not readily recoverable within a human lifetime or several generations; the actual timescale varies by process.
- Just transition
- A transition that protects affected workers and communities and distributes burdens fairly.
- Methane
- A heat-trapping gas from fossil operations, agriculture, waste and natural sources.
- Mitigation
- Actions that reduce greenhouse-gas emissions or increase their removal.
- Nationally determined contribution (NDC)
- A country’s climate action commitment under the Paris Agreement.
- Net-zero CO₂
- Human-caused CO₂ emissions balanced by human-caused CO₂ removals.
- Overshoot
- A period in which warming exceeds a specified temperature limit before returning below it.
- Precautionary principle
- Acting to reduce the threat of serious or irreversible harm despite incomplete certainty.
- Reinforcing feedback
- A process that amplifies an initial change; often called positive feedback, which does not mean beneficial.
- Resilience
- The ability to function, adapt and recover during disruptions.
- Territorial emissions
- Emissions released within a jurisdiction’s boundaries, rather than the full emissions associated with its consumption.
- Tipping point
- A threshold beyond which a system may shift into a different state, potentially difficult to reverse.
- UNEP
- United Nations Environment Programme.
- UNFCCC
- United Nations Framework Convention on Climate Change; also the associated international climate process.
- Climageddon Feedback Loop (CFL)
- Job One’s systems-risk framework for interacting feedbacks, tipping elements, nonlinear responses and human-system cascades.
- Mitigation deterrence
- Delay or weakening of emissions cuts because future removal or another promised remedy is expected to compensate.
- Precautionary stress test
- A defined examination of a more damaging scenario to assess whether a plan remains useful; it is not automatically a best-estimate forecast.
- Climate-attributable premature deaths
- Deaths occurring earlier than they would in a defined comparison scenario because of climate-related pathways, accounting for overlaps and other causes.
Questions you can use with an AI assistant
Use these prompts to investigate and act. Ask for dated primary sources, check the answers and avoid entering private information unnecessarily.
- “Using this article’s references, distinguish measured outcomes, conditional projections and editorial judgments. Identify any claim the evidence does not establish.”
- “Find my jurisdiction’s current emissions target, baseline, latest inventory and implementation plan. Is it on track, and does its accounting include imported emissions?”
- “Identify three practical local actions that weaken several of these climate barriers together. Explain costs, who benefits, who might be disadvantaged and how results could be measured.”
- “Help me choose a manageable starting point in the Job One for Humanity Plan B for my household and community. Separate immediate preparation from collective emissions-reduction action.”
Bibliography and supporting evidence
The references below distinguish independent evidence from the organization’s action resources. Dates identify the report or historical record, not necessarily the latest revision of a linked webpage.
- UNEP (2026). Emissions Gap Report 2026: The Point of Return; official findings, October 21. Latest pathway comparison and conditional return to 1.5°C.
- IEA (2026). Global Energy Review 2026, CO₂ emissions chapter. 2025 energy-related CO₂ and the measurable contribution of clean technologies.
- IEA (2026). Global Methane Tracker 2026, Key findings. Fossil methane emissions, existing controls, and uneven implementation.
- SEI, Climate Analytics and IISD (2025). Production Gap Report 2025. Government fossil production plans compared with temperature-aligned pathways.
- IPCC (2023). AR6 Synthesis Report, Summary for Policymakers. Cumulative emissions, escalating risks, equity, mitigation and adaptation.
- IPCC (2022). AR6 Working Group III, Chapter 1: Introduction and Framing. Political economy, unequal responsibility and vested interests.
- IPCC (2022). AR6 Working Group III, Chapter 2: Emissions trends and drivers. Demand, development, emissions and carbon lock-in.
- IPCC (2022). AR6 Working Group III, Chapter 3: Mitigation pathways compatible with long-term goals. Delays, cumulative emissions and pathway feasibility.
- IPCC (2022). AR6 Working Group III, Chapter 4: Mitigation and development pathways in the near- to mid-term. Transition speed, distributional effects and institutional barriers.
- IPCC (2022). AR6 Working Group III, Chapter 5: Demand, services and social aspects of mitigation. Behavior, fairness, public participation and acceptable policy design.
- IPCC (2022). AR6 Working Group III, Chapter 6: Energy systems. Energy security, infrastructure replacement and system planning.
- IPCC (2022). AR6 Working Group III, Chapter 12: Cross sectoral perspectives. Carbon removal and cross-sector mitigation options and limits.
- IPCC (2022). AR6 Working Group III, Chapter 13: National and sub-national policies and institutions. Institutional capacity, governance and durable climate policy.
- IPCC (2022). AR6 Working Group III, Chapter 14: International cooperation. Collective action, international institutions and cooperation.
- IPCC (2022). AR6 Working Group III, Chapter 15: Investment and finance. Investment barriers, financing costs and unequal access to capital.
- IPCC (2022). AR6 Working Group III, Chapter 17: Accelerating the transition in the context of sustainable development. Overcoming interacting barriers and aligning development and mitigation.
- IPCC (2022). AR6 Working Group II, Chapter 5: Food, Fibre and Other Ecosystem Products. Food production, food security and adaptation.
- IPCC (2022). AR6 Working Group II, Chapter 16: Key Risks across Sectors and Regions. Compound risks, vulnerability, irreversible losses and adaptation limits.
- Armstrong McKay, D. I., et al. (2022). Exceeding 1.5°C global warming could trigger multiple climate tipping points. Science 377, eabn7950. Assessment of tipping elements and uncertain threshold ranges.
- MacDougall, A. H., et al. (2020). Is there warming in the pipeline? A multi-model analysis of the Zero Emissions Commitment from CO₂. Biogeosciences 17, 2987–3016. Why net-zero CO₂ can approximately stabilize CO₂-driven surface warming.
- Supran, G., Rahmstorf, S., and Oreskes, N. (2023). Assessing ExxonMobil’s global warming projections. Science 379, eabk0063. Company climate knowledge compared with public communications.
- President Lyndon B. Johnson (November 6, 1965). Statement responding to the Science Advisory Committee pollution report. Contemporary public record of fossil fuel CO₂ accumulation being brought to presidential attention.
- UNFCCC Archives. Prologue to the Climate Change Negotiations. The 1979 First World Climate Conference and international scientific recognition.
- IPCC (1990). First Assessment Report, Working Group I. Early formal scientific assessment; distinguish concentration stabilization from later temperature targets.
- UNFCCC (1992). Convention, Article 3: Principles. Precaution, intergenerational protection and differentiated responsibilities.
- UNFCCC. Paris Agreement Implementation and Compliance Committee: Nature and function. Compliance committee is facilitative and does not impose penalties.
- UNEP (2010). The Emissions Gap Report 2010. Early quantified warning about the ambition gap.
- UNEP (2019). Cut global emissions by 7.6 percent every year for next decade to meet 1.5°C Paris target. Historical benchmark showing the cost of delay.
- UNEP (2020). Emissions Gap Report 2020. Pandemic-related decline did not establish a durable safe trajectory.
- UNFCCC (2024). Nationally determined contributions synthesis report. Contemporaneous comparison of pledges with AR6 pathways.
- UK Government (2024). Final statement for the third carbon budget, 2018–2022. Verified performance against a legally established carbon budget.
- European Commission / EEA (2021). EU achieves 20-20-20 climate targets. 2020 targets and the pandemic-related component of the final-year decline.
- California EPA (2021). 2020 State Agency Greenhouse Gas Reduction Report Card. Documents attainment of California’s 2020 emissions target in 2016.
- Ontario Government. The End of Coal. Coal-electricity phaseout completed in 2014 and contribution to the provincial target.
- Stechemesser, A., et al. (2024). Climate policies that achieved major emission reductions: Global evidence from two decades. Science 385, 884–892. Evaluation of 1,500 policies across 41 countries; identifies large reductions associated with policy packages.
- Job One for Humanity. Climate Change Solutions and Resilience Plan B. Practical action destination; organizational guidance rather than an independent scientific assessment.
- Hansen, J., et al. (2008). Target atmospheric CO₂: Where should humanity aim? Open Atmospheric Science Journal 2, 217–231. Warns that then-current CO₂ around 385 ppm was too high and argues for an initial target of 350 ppm or less; does not establish a precise universal 386 ppm threshold.
- Hansen, J., et al. (2017). Young people’s burden: requirement of negative CO₂ emissions. Earth System Dynamics 8, 577–616. Intergenerational risks and scenario-dependent costs and feasibility of massive future extraction.
- Anderson, K., and Peters, G. (2016). The trouble with negative emissions. Science 354, 182–183. Warns about reliance on future negative emissions that may fail to materialize.
- McLaren, D. (2020). Quantifying the potential scale of mitigation deterrence from greenhouse gas removal techniques. Climatic Change 162, 2411–2428. Explains substitution of later removal for earlier mitigation and risks from non-delivery and rebound effects.
- Job One for Humanity (updated October 16, 2026). The Climageddon Feedback Loop. Organizational systems-risk framework; distinguishes its operational use of runaway warming from a planetary runaway greenhouse.
- Job One for Humanity (updated October 21, 2026). Why Are Job One for Humanity’s Climate Change Forecasts 20%–30% Worse than IPCC’s? Current organizational position: a conditional 20–30% precautionary planning adjustment. The URL retains an older name.
- Job One for Humanity. IPCC Climate Change Forecasts Under the Microscope: What Should We Defensibly Add to Underestimated IPCC Projections? Conditions for selected near-term warming comparisons; distinguishes future additional warming from the observed starting anomaly.
- Wunderling, N., Donges, J. F., Kurths, J., and Winkelmann, R. (2021). Interacting tipping elements increase risk of climate domino effects under global warming. Earth System Dynamics 12, 601–619. Conceptual network modeling of interacting tipping elements; supports examining cascades, not a universal dated global collapse threshold.
- World Health Organization (2014). Quantitative risk assessment of the effects of climate change on selected causes of death, 2030s and 2050s. Models selected mortality pathways under explicit assumptions; neither a complete all-cause forecast nor validation of Job One’s 2050–2070 range.
- Pearce, J. M., and Parncutt, R. (2023). Quantifying Global Greenhouse Gas Emissions in Human Deaths to Guide Energy Policy. Energies 16, 6074. Discusses an order-of-magnitude estimate of roughly one billion premature deaths over approximately a century; does not establish that toll during 2050–2070.
- Job One for Humanity. Primary and Secondary Climate Change Consequences. Organizational inventory of physical and downstream social risks; a list of pathways is not itself a de-duplicated mortality calculation.
- IPCC (2018). Global Warming of 1.5°C, Headline Statements and Summary for Policymakers. Historical assessment of cumulative removal in 1.5°C pathways; includes land-based and technological methods.
Article Author Information
This document was created by Lawrence Wollersheim, Senior DMAP analyst at the Universe Institute. AI also helped research, assemble, and verify the accuracy of this article.
Showing 1 reaction