
The following forecast concerns a dangerous, highly interacting cascade of climate change tipping points, positive feedback loops, and nonlinear reactions, originally described by Job One for Humanity as the Climageddon Feedback Loop (CFL). The CFL process contains critical climate-survival knowledge that every global politician must understand. It also contains critical climate-survival knowledge for the future of every individual, family, business, and nation.

Prologue
This article is about the rapidly unfolding Climageddon Feedback Loop (CFS). The best way to think about the Climageddon Feedback Loop is as a huge collective positive feedback loop composed of an ever-growing number of lesser positive feedback loops, tipping points, and non-linear reactions across and from most of the critical climate change processes within the climate system and its sub-systems.
When the Climageddon Feedback Loop reaches its internal collective triggering point, it creates a runaway cascade of more and faster crossed tipping points, triggered positive feedback loops, and non-linear reactions within the climate system. At that point, humanity will face the worst single global outcome in its history. (If you are not certain about why a huge collection of triggering positive feedback loops will be so dangerous of themselves, take a moment to click this link to clearly understand the life and death importance it will have for our climate change futures.)
The Climageddon Feedback Loop is also critical to humanity's future because when it is unknown, understated, or intentionally or unintentionally overlooked, those political and governmental individuals who are responsible for managing the escalating climate change crisis will be blinded to several vital factors:
1. They will continue to falsely see the current and future unfolding of climate change consequences and their time frames --- in a gradual, linear, and somewhat predicable step-by-step progression when nothing could be farther from the truth, as you will discover below.
2. They will severely underestimate rapidly approaching climate change consequences and timetables, and miscalculate the required fossil fuel reduction solutions. Unfortunately, the Climageddon Feedback Loop-driven climate change consequences and rising temperatures become irreversible for hundreds to thousands of years, leading humanity to a global catastrophe, mass destruction, and a truly massive die-off.
One and two above mean that understanding the Climageddon Feedback Loop is absolutely the single most important fact and process our politicians must know if humanity is to survive the accelerating climate change crisis.
The Climageddon Feedback Loop process describes what can happen not just to the climate change consequence patterns but it also describes what can happen within any complex adaptive system, such as our global economic, political, social, and ecological systems, when the tipping points, positive feedback loops and non-linear reactions begin to take place between and within the economic, political, social, and ecological master system and their many feeder subsystems. Once you understand this deadly process, you will grasp the fragility of modern society when things start going wrong involving system and subsystem tipping points, feedback loops, and non-linear reactions, and how our systems and subsystems can collapse far faster than anyone has predicted or can adapt to.
Understanding this Climageddon Feedback Loop process is particularly important right now because climate change is the main driver, accelerating, amplifying, and further disrupting most of the other 14 crises of the global polycrisis. There are not many things short of a nuclear attack that will produce as much chaos and collapse as a system and it subsystems entering the Climageddon Feedback Loop process.

In this upgrade, we present three forecast ranges. The first forecast level is establishment science, the center of the bell curve of current science.
But there are many problems with the bell curve's center in current science. It contains financial and political conflicts of interest, errors and omissions, individual or organizational biases, intentional disinformation or misinformation (to maintain hidden advantage or control), failures to provide value or timeframe ranges for known unknowns within a system, etc., etc. In other words, blind acceptance of establishment-approved reports must also account for the various problems that arise, especially regarding data on the climate change emergency, and for the huge political and economic impacts that adverse or politically incorrect publicly released information could radically change.
Because of issues with establishment-based climate change summary reports, we have created a second category on the page. It is a discounted version of establishment-based climate change summary reports for the area under discussion.
There is also a third level of predictions for consequences and timeframe ranges. It is the Job One For Humanity forecast version. This version aims to compensate as much as possible for the many climate problems listed below, producing considerably more accurate ranges and timelines for the climate change consequences of the issue being discussed.
Finally, we have provided a link to a special glossary of terms and abbreviations used in the analysis below, which you may not be familiar with.

Introduction
What you’re about to read is a guided mini tour of the master Climageddon Feedback Loop (aka the Climageddon Scenario), which is a fancy name for a brutally simple idea: climate change doesn’t just “get a bit worse each year.” It can switch gears, going from slow, linear creep to fast, exponential chaos when key tipping points, feedback loops, and non-linear reactions start setting each other off like a chain of bad decisions at 2 a.m. This analysis lays out the most likely sequence of how those climate system and subsystem triggers unfold and, just as importantly, the watch indicators that tell you which stage is lighting up in real time.
If you follow the logic below, you’ll be able to see what almost nobody sees clearly: how early triggers can knock over later triggers, which ignite still more until the whole process starts behaving like a runaway train of escalating consequences, potentially becoming unstoppable for centuries to thousands of years once enough self-reinforcing loops are active.
The maddening part is that the people with the most power to slow or stop this cascade, politicians and many of the ultra-wealthy, often don’t grasp the mechanism, don’t want to grasp it, or pretend not to because the current system pays them to keep the engine running. Still, the point here isn’t despair. The point is clarity: once citizens can recognize the pattern and the indicators, we can push for earlier, smarter interventions, the kind that still keep the future from becoming a long, expensive lesson in “we thought we had more time.
The prioritized sequence of climate change tipping points, feedback loops, and non-linear reactions, the politicians of the world need to be fully focused on preventing, or we are going to be in an uncontrollable, painful situation for centuries to thousands of years
How is the prioritized sequence below ranked:
-
-
Timescale/speed (fast amplifiers and rate-shifts first)
-
Leverage (how strongly it couples into others)
-
Confidence (how solid the evidence is, while still tracking tails)
-
Point of no return proximity ([PoNR] how close we are to commitment/resilience loss
-

Understanding the difference between linear and exponential increases in the consequences of climate change driven by a triggered Climageddon Feedback Loop is critical!
Once the Climageddon Feedback Loop is triggered, the consequences of climate change will not look like they have over the last six decades. They will no longer grow in a gradual, linear manner. They will begin growing in severity, frequency, and scale at an exponential rate. Many people really do not visualize and grasp what exponential growth means. The following illustration will help you understand it exponentially and the life-and-death factor it will create: accelerating, worsening, and more severe climate change consequences that do not arrive in a gradual, linear manner, but faster than almost any individual, business, or nation can adapt to.
We have provided the following graph to illustrate the dangers of an exponential increase in the consequences of climate change. The red line in the graph below represents a gradual, linear, steady, and mostly predictable trajectory of climate change consequences. (Linear progression, for example, equals 1, 2, 3, 4, 5, 6, 7, 8, etc.)
The green line below illustrates a sudden, exponential, and highly unpredictable trajectory of climate change's consequences. (For example, an exponential progression equals 2, 4, 8, 16, 32, 64, 128, 264, etc.)

The Cascading Climate Change Risk Ledger with points of no return and the 3-track forecast ranges mentioned in the prologue
1) Fast amplifiers: water vapor + lapse-rate + cloud feedback uncertainty (system gain)
Role: fast feedback gain that makes every extra forcing unit more dangerous.
PoNR: not a single cliff, but a growing “gain” regime where extremes and compound events become structurally more likely (harder to reverse even if warming pauses because ocean heat and hydrologic regime shifts persist).
Timeframe: immediate; scales with temperature.
Consequence: amplifies warming and extremes; clouds remain a key uncertainty driver in sensitivity and near-term trajectory.
Overshoot window: 2026–2032.
Watch indicators: humidity profiles, extreme precipitation intensity trends, outgoing longwave vs absorbed solar radiation shifts.
2) Arctic sea ice/snow/albedo loss (fast reinforcing loop)
Role: fast, high-leverage regional amplifier with global coupling.
PoNR: “first ice-free day/season” isn’t the only PoNR. The earlier PoNR is persistent loss of summer ice resilience (harder recovery, longer open-water season), which accelerates Arctic warming and alters circulation boundary conditions.
Timeframe: 2020s–2040s for major step-changes, but uncertainty is wide.
Overshoot window: 2026–2032 (Arctic amplification is already outsized).
Watch indicators: September minimum extent/volume, ice thickness, albedo trends, Arctic temperature anomaly.

3) Ocean heat content + stratification + marine heatwaves (system-wide stress multiplier)
Role: the ocean is the heat reservoir; it drives persistence and lagged impacts.
PoNR: rising ocean heat content is effectively a commitment reservoir. Even if forcing stabilizes, the system keeps paying the bill (delays/thermal inertia). IPCC SROCC explicitly emphasizes multi-decadal to millennial response times and commitment.
Timeframe: ongoing now; escalates through 2030s and beyond.
Consequences (IPCC-anchored):
-
-
Energy imbalance doubling implies continued heat uptake pressure.
-
Overshoot window: 2026–2032 (marine heatwaves + fisheries stress), 2033–2045 (systemic deoxygenation/acidification compounding).
Watch indicators: global ocean heat content, marine heatwave frequency, subsurface temperature trends, oxygen minimum zone expansion.
4) Coral reefs as an early “point of no return” ecosystem collapse (nonlinear socio-ecological hit)
Role: not the biggest global feedback, but a frontline PoNR that signals we’re already shredding resilience.
PoNR: sustained thermal stress leading to repeated mass bleaching creates long-term decline; many reefs do not recover on human timescales.
Consequence ranges (IPCC SR1.5):
-
-
At 1.5°C, warm-water coral reefs decline 70–90%.
-
At 2°C, >99% lost.
-
Timeframe: essentially now through the 2030s as overshoot persists.
Overshoot window: 2026–2032 (already in play).
Watch indicators: degree heating weeks, bleaching frequency, reef carbonate accretion vs erosion.
5) Land carbon instability: fire-weather feedbacks, drought stress, dieback transitions
Role: turns the land from “helper sink” into “unreliable friend with a flamethrower.”
PoNR: repeated extreme years can push ecosystems across mortality/regeneration thresholds (loss of resilience), after which recovery is slow and carbon debt persists.
Timeframe: now → 2040s for increased volatility and regional source years.
Consequences: disturbance emissions + reduced uptake; increases atmospheric CO₂ growth variability.
Overshoot window: 2026–2032 (compound extremes), 2033–2045 (biome reorganization risk).
Watch indicators: VPD, fire weather indices, tropical forest dry-season length, net biome productivity anomalies.
6) Carbon sinks: “stable until stressed” (airborne fraction regime-break risk)
Role: if sinks weaken materially, emissions translate into more atmospheric CO₂ per unit burned.
PoNR: the PoNR isn’t “sinks weaken” in a smooth line; it’s a regime break where disturbance + warming flips regions and reduces global sink reliability.
Evidence anchor (Center track): global airborne fraction has shown no significant long-term trend over much of the historical record (sinks still absorb a large share).
(That stability is real, and it fools people into complacency.)
Reasonable variation: increasing volatility and episodic sink failures can precede any global trend break.
Job One: treat sink weakening as a plausible mid-term amplifier once compound extremes stack and biosphere thresholds are crossed.
Overshoot window: 2033–2045 (regime-break risk grows), but watch now.
Watch indicators: atmospheric CO₂ growth rate vs emissions, land/ocean sink anomalies, El Niño amplification effects.
7) Permafrost carbon feedback (slow-burn amplifier with nonlinear sub-processes)
Role: persistent amplifier; difficult to stop once it scales.
PoNR: growth of abrupt thaw and fire-permafrost interactions can shift the response away from linear, making feedback harder to bound.
Consequence range (IPCC AR6): projected CO₂ release 3–41 PgC per 1°C warming by 2100, with low confidence in timing/magnitude split CO₂ vs CH₄.
Job One adjustment: credible critiques note AR6 permafrost estimates likely underestimate because key processes like abrupt thaw and fire interactions are excluded or simplified. (Link to climate change glossary.)
Timeframe: ramps through 2030s–2100; feedback persists beyond.
Overshoot window: 2033–2045 (material amplifier), 2045–2050+ (deepening lock-in).
Watch indicators: permafrost temperature, active layer thickness, thermokarst area change, Arctic wildfire extent, methane flux hotspots.

8) Ice sheets (Greenland + West Antarctica): commitment thresholds and multi-millennial sea-level PoNR
Role: the ultimate “you don’t get to undo this later” system.
PoNR: commitment can occur before dramatic visible collapse. Overshoot magnitude and duration matter for Greenland stability.
Consequence ranges (IPCC AR6 commitment):
-
-
Committed global mean sea level rise over ~2000 years: about 2–6 m with ~2°C peak warming (order-of-magnitude commitment framing).
-
SROCC emphasizes committed long-term change due to long response times even after forcing stabilizes. (Link to climate change glossary.)
-
Timeframe: commitment can be this century; full expression unfolds over centuries to millennia.
Overshoot window: PoNR risk grows fast in 2033–2045 and beyond, but commitment can be set earlier.
Watch indicators: Greenland mass balance, outlet glacier acceleration, grounding line retreat metrics, meltwater flux, Antarctic shelf thinning.
9) AMOC: early warning, loss of resilience, and disputed but nontrivial collapse windows (Link to climate change glossary.)
Role: a high-impact circulation tipping element with global rainfall/food implications.
PoNR: measurable approach to a bifurcation (loss of resilience) can precede collapse.
Center track (IPCC AR6): AMOC will very likely decline; medium confidence that the decline will not involve abrupt collapse before 2100.
Reasonable variation (post-AR6 uncertainty):
-
-
A Nature Communications early-warning paper estimates collapse around mid-century under current scenario assumptions (highly debated, but important as a signal).
-
A physics-based observable indicator study develops an AMOC tipping early warning signal and finds reanalysis suggests present-day AMOC is “on route to tipping” (their framing).
-
A 2025 AGU study (25 models) reports a broad percentile timing band for onset of collapse (example: ~2063 median, with a wide range across models/scenarios).
-
Job One: treat AMOC as a governance-grade tail risk: even if collapse is not the median expectation, the consequences are severe enough that you plan against it.
Overshoot window: 2033–2045 (approach/PoNR window), 2045–2050+ (higher risk of committed transition depending on pathway).
Watch indicators: freshwater transport metrics (e.g., southern Atlantic boundary indicators), subpolar salinity/density, Labrador Sea convection, sustained trend changes vs decadal variability.
10) Amazon dieback/rainfall recycling breakdown (biosphere tipping with carbon + hydrology coupling)
Role: major biosphere tipping candidate; interacts with fire, drought, land use, and circulation.
PoNR: resilience loss shows up before full dieback: lengthening dry season, reduced evapotranspiration recycling, and increased fire-driven fragmentation can commit the system to decline trajectories.
Consequence anchors (from Global Tipping Points assessment summaries):
-
-
Carbon at stake on the order of ~150–200 GtC in biomass + soils (order-of-magnitude anchor).
-
Extreme case modeling indicates potential additional warming on the order of ~+0.3°C by 2100 for total dieback scenarios (high uncertainty; treat as tail storyline).
-
Timeframe: risk rises sharply 2030s–2050; strongly dependent on deforestation/fire policy coupling.
Overshoot window: 2033–2045 (PoNR tightening), 2045–2050+ (higher commitment risk).
Watch indicators: dry-season length, evapotranspiration anomalies, fire recurrence, deforestation/fragmentation rates.
11) Forcing rise + aerosol “unmasking” rate-shock
Aerosol unmasking refers to the idea that human-made aerosols—tiny soot-like particles from sources such as industrial pollution, fossil fuel combustion, and biomass combustion—temporarily cool the planet by reflecting sunlight and helping clouds form. This cooling effect counteracts some of the warming caused by greenhouse gases. When air pollution is reduced and aerosol emissions decline, this cooling effect diminishes, effectively “unmasking” the full warming from greenhouse gases. This can lead to a sudden increase in the rate of warming even if greenhouse gas emissions stay the same.
Role: near-term accelerator (changes the slope of warming, which is what breaks planning).
PoNR (pre-tipping): rapid aerosol reductions while GHG forcing stays high create an effective irreversible near-term heat jump (you don’t safely “turn aerosols back on” at scale without massive side effects). SROCC flags long-lived commitment and thresholds in the cryosphere/ocean even after forcing stabilizes. Please keep in mind that the point of no return does not equal a tipping point. The PoNR is the earlier point at which commitment, hysteresis, or resilience loss means “even if you stop pushing, the system tends to keep going towards its tipping point!”
Timeframe (onset): now → 2030s (immediate to decade-scale).
Consequence ranges (global mean, approximate):
-
-
Establishment center: IMO2020 shipping sulfur rule warming effect in one modeling study: ~+0.03°C (2020–2040 average) with 5–95% range −0.09 to +0.19°C.
-
Reasonable variation: analyses/assessments frequently cluster around ~0.05°C by ~2050 attributable to the shipping sulfur rule alone (other aerosol changes add more).
-
Job One: treat aerosol uncertainty as a rate-amplifier, especially when combined with observed increases in Earth’s energy imbalance. Satellite-based assessment shows energy imbalance roughly doubled from ~0.5±0.2 to ~1.0±0.2 W/m² across recent decades.
-
Overshoot window tag: 2026–2032 (rate shocks are now problems, not future problems).
Watch indicators: aerosol optical depth trends, shipping emissions metrics, CERES-derived absorbed solar radiation, and atmospheric CO₂ growth rate vs emissions. (Link to climate change glossary.)
Currently, the aerosol unmasking issue is less of a concern because we are emitting far more greenhouse gases from fossil fuels into the atmosphere each year. Any unmasking is more than offset by the increased production of fossil-fuel soot-like particles. But when the world finally wakes up to the fact that we'll have to radically reduce fossil fuel use immediately, or there won't be much of humanity left, the aerosol unmasking problem will rear its ugly head and could quickly boost average global temperature by another 0.5-1°C. Think of the aerosol unmasking tipping point as a time bomb that will unveil itself at potentially the worst possible time when the other issues listed below are already raging.

Critical “Points of no return” summary layer (what precedes the climate cliff and the master Climageddon Feedback Loop)
Across the ledger, points of no return cluster into three types:
-
-
Commitment thresholds (hysteresis/long response times) (Link to climate change glossary.)
-
Ice sheets and sea level commitment on multi-millennial horizons.
-
-
Loss of resilience/early warning signals (critical slowing down, increasing variance)
-
Global Tipping Points report describes early warning methods and notes evidence consistent with movement toward tipping in several elements.
-
AMOC has specific proposed observable indicators.
-
-
Ecological “functional collapse” thresholds (recovery becomes unlikely on human timescales)
-
Coral reefs: 70–90% decline at 1.5°C; >99% at 2°C.
-
-

Summary for the Critical Interaction List (which tipping points, feedback loops, and non-linear reactions kick into each other, and why it cascades)
This is the core “Climageddon-ish” structure: risk multiplies because each tipping point, feedback loop, and non-linear reaction node below changes the boundary conditions of others.
-
-
Forcing + aerosol unmasking → faster warming rate
↳ accelerates Arctic albedo loss, ocean heat uptake, hydrologic extremes, biosphere stress. -
Arctic amplification + Greenland melt → freshwater anomalies
↳ raises AMOC weakening/collapse risk and regional climate disruption. -
Ocean warming/stratification → marine heatwaves + ecosystem collapse
↳ reduces resilience, worsens carbon-cycle volatility, stresses fisheries/food. -
Land stress + fires + dieback → weaker land sink + more CO₂/CH₄
↳ pushes warming higher, increasing probability of crossing other thresholds. -
Permafrost thaw → persistent carbon feedback
↳ tightens the “carbon budget vise” and raises long-run warming commitment. -
Ice sheet commitment → multi-millennial sea level lock-in
↳ permanent coastal reconfiguration and long-run destabilization. -
AMOC shift → rainfall belts/monsoons/food systems
↳ can feed back into land carbon and political stability (human system coupling).
-
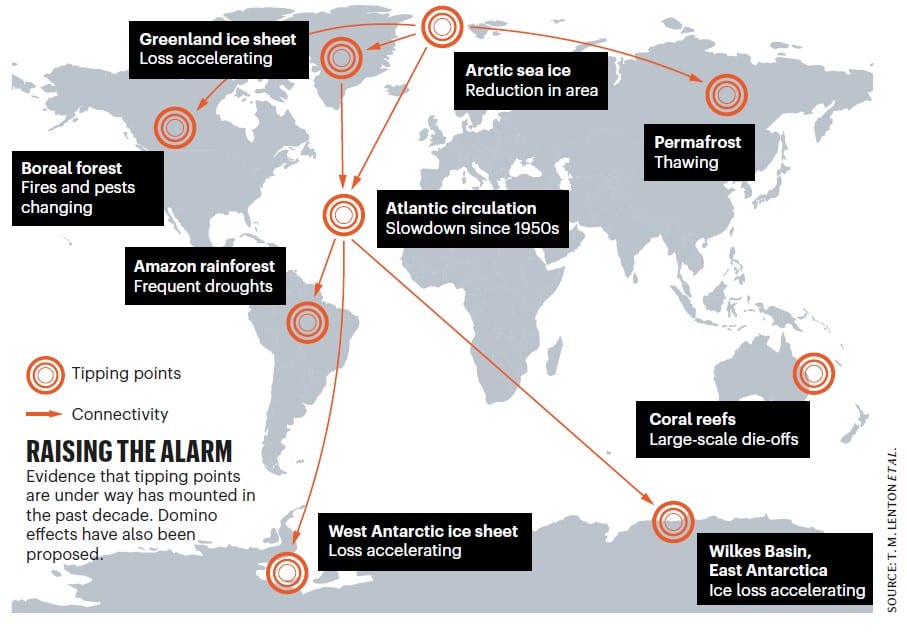
Below is another interaction illustration and visualization of the CFL.

All of the above lead to the question: when will the Climageddon Feedback Loop reach its own internal triggering and tipping point, and start the accelerating cascade of crossing more climate change tipping points, triggering more positive feedback loops, and activating more non-linear reactions in the climate system and subsystems, faster and faster?
Here is how we came to our best estimate of the CFL's internal triggering and tipping point. Here are the temperatures at which major climate system tipping points start tripping:
Around 1.5°C, best-estimate thresholds sit near Greenland, West Antarctica, warm-water coral reefs, and abrupt permafrost thaw.
From 1.5 to 2°C, risks rise further for Greenland and West Antarctica; near-complete warm-water coral die-off becomes more likely; the best-estimate threshold for Labrador-Irminger / subpolar gyre convection collapse is crossed; AMOC risk, boreal shifts, glacier loss, regular Arctic summer sea-ice loss, and widespread gradual permafrost thaw all become more serious.
From 2 to 3°C, Amazon dieback, East Antarctic subglacial basin collapse, and West African monsoon shift become non-negligible and increase; subpolar gyre collapse, boreal forest dieback, and AMOC collapse become more likely.
Above about 3.5 to 4°C, Amazon dieback becomes likely, large-scale permafrost collapse becomes possible to likely, boreal forest shifts become likely, and AMOC risk rises further. Beyond ~5°C sustained for centuries, even East Antarctica becomes a serious long-term commitment risk; beyond ~6°C, stratocumulus breakup appears in one model as a possible global tipping mechanism.
What this means is:
-
-
Several major tipping elements have central thresholds around 1.5°C;
-
A 2024 review found that most mapped tipping-element interactions are destabilizing, and that cascades cannot be ruled out between 1.5 and 2.0°C, with faster elements like AMOC and the Amazon joining on shorter timescales above 2°C;
-
A 2025 probability study found current-policy-like warming is unsafe, with a conservative average triggering probability of about 62% across 16 tipping elements under an SSP2-4.5-like path, and nine of them above 50%.
-
So here is how we forecast it will look:
-
-
Entry into the CFL trigger zone: about 1.5°C sustained warming. This is where multiple low-threshold elements are already in play and cascade risk stops being a fringe idea.
-
Most defensible single-number estimate for the collective trigger: about 1.8 to 2.0°C sustained warming above preindustrial, because by then multiple low-threshold elements are either likely triggered or materially closer, and interaction-driven cascade risk becomes a major planning assumption rather than a speculative edge case. This is an inference from the threshold bands, interaction signs, and current-policy probability studies, not a formally published single threshold.
-
Deep-cascade regime: about 2.5 to 3.0°C sustained warming, where many more elements become non-negligible or likely, and the system begins to look less like “bad climate change” and more like “multiple Earth-system subsystems restructuring at once.”
-
Our best defensible estimate for the Climageddon Feedback Loop collective trigger is about 2.0°C of sustained global warming, with 1.5°C as the entry zone and 2.5-3.0°C as the deep-cascade regime. That estimate is a synthesis, not an officially published threshold, but it is where the current evidence points once you combine threshold ranges, interaction maps, and current-policy trigger probabilities.
The world has probably already had its first calendar year above 1.5°C in 2024. We are now at the Climageddon Feedback Loop collective trigger doorway and leaning through it.
What happens in human suffering terms after the collective Climageddon Feedback Loop trigger is crossed
At first, it does not look like a dramatic movie scene. It looks like a compounding failure.
You get more deadly heat, stronger flood bursts, deeper drought, larger wildfire seasons, crop shocks, fisheries damage, coral reef loss, glacier-fed river disruption, insurance retreat, infrastructure stress, and repeated hits to the same vulnerable regions. The IPCC is blunt: every increment of warming intensifies multiple concurrent hazards, and compound and cascading risks become harder to manage.
As the system moves deeper into the 2 to 3°C range, the burden shifts from “more disasters” to “fewer reliable places.” Water stress, food insecurity, repeated harvest failures, coastal flooding and relocation, heat that periodically overwhelms labor and health systems, and ecosystem losses start to interact with political fragility, migration pressure, and economic breakdown. Adaptation becomes less effective, and some regions and systems hit hard or soft limits. The poor and politically weak get hit first and worst, because the climate system remains rude in a remarkably class-conscious way.
Over the longer term, once multiple ice-sheet and biosphere thresholds are crossed, you are no longer arguing about next quarter’s weather. You are talking about centuries-to-millennia-long coastline retreat, sea-level rise commitments, altered ocean circulation, permanent ecosystem loss, and locked-in damage that continues even if emissions later fall. IPCC states plainly that choices made this decade have consequences for thousands of years. That is the real meaning of a collective CFL trigger: not instant planetary death, but the loss of control over a growing share of the future.

Conclusion
What this risk analysis and ledger above shows, if you read it like an adult and not like a press office, is that we are no longer dealing with a neat “warming number” that rises politely and waits for quarterly earnings calls. We are pushing a complex adaptive system toward points of no return that arrive before headline tipping-point events, where commitment, hysteresis, and cascading feedbacks lock in consequences that cannot be meaningfully reversed on human timescales.
The center of the bell curve is not “safe,” it is merely “most publishable,” and it routinely underweights the tails where civilization-level damage lives. Once you accept that ice sheets can commit humanity to meters of sea-level rise over centuries and millennia, that ecosystems can cross functional-collapse thresholds in a decade, and that circulation and carbon-cycle instabilities can interact in ways that accelerate timelines, the precautionary principle is no longer strong enough.
Precaution says “act despite uncertainty.” This data says something harsher: uncertainty is the accelerant because it hides the approach to the points of no return until the system’s inertia and feedbacks have already taken over.
Political and corporate leaders have to plan to the reasonable adjusted ranges, not the most comfortable median, because when the Climageddon-style feedback cascade takes hold the costs stop being “high but manageable” and become vastly destructive, globally destabilizing, and effectively irreversible, with consequences that will echo for hundreds to thousands of years, turning ordinary life for future generations into an adaptation-and-survival grind that no economy, no military, and no PR campaign can buy its way out of.
When you finish reading this page, we also strongly recommend reading the following two additional articles. One explains in full detail with many illustrations the very dangerous Climageddon Feedback Loop, which is only described in part above in the tipping point sequence. The other article provides up-to-date, uncensored timeframes for critical temperature increases caused by climate change.
And finally, to help you understand and clearly visualize the global warming-driven side of humanity's likely future, review the following global warming consequences illustration starting from the bottom up! Starting from the bottom, this illustration reflects the unfolding, ever-worsening progression of interacting climate change consequences, including tipping points, feedback loops, and nonlinear responses, as we forecast and project.
The top of the illustration shows the later phases of the Climageddon Feedback Loop extinction model, including its processes and consequences. The bottom of the illustration shows you the earlier consequences.
When you reach the top of the illustration below, you will realize that it is not just the primary climate change consequences described here that will cause a massive global die-off by 2050. You will also come to realize that the secondary climate change consequences described here (and shown at the very top of the illustration below will be the greatest and fastest way the great global die-off will likely occur.

Read the full original description of the Climageddon Feedback Loop found here.
We also strongly recommend that you read our most recent and complete forecast of climate change consequences and timelines, which include allowances for the above tipping points, feedback loops, and nonlinear reactions.
Research and Analysis Factors Considered in Creating this Analysis
1. Reasonable data variation (where the center of the bell curve is most likely to understate tails)
If you’re building a Job One “don’t get civilization killed” forecast, these are the biggest widening points:
-
-
Aerosols/clouds: small forcing changes can produce disproportionately large near-term rate changes; uncertainty is structurally high.
-
Ice-sheet nonlinearities: low confidence ≠ low consequence; commitment horizons are millennial.
-
AMOC: literature spread is wide; early warning work increases decision relevance even if collapse isn’t “most likely.”
-
Permafrost abrupt thaw: credible under-modeling concerns; budgets likely tighter than simple linear estimates.
-
Biosphere tipping interactions: Amazon/fire/land-use coupling can cause nonlinear transitions not captured by smooth global means.
-
2. DMAP + systems sanity audit (so we don’t regress into linear bedtime stories)
(DMAP refers to a new dialectical meta-systemic analysis and problem-solving methodology described here.)
-
-
Systems congruence: this ledger treats tipping elements as coupled nodes with lags, thresholds, and feedbacks, not isolated bullets. It explicitly includes commitment (long response times) and cascades (interaction edges).
-
Dialectical completeness (DMAP style):
-
We are not confusing what is observed (trend/weakening) with what is committed (irreversibility/lock-in).
-
We are separating fast amplifiers from slow but irreversible commitments, while showing how the fast ones shove the slow ones across points of no return (PoNRs).
-
We are treating “uncertainty” as a range management problem, not an excuse for inaction.
-
-
The following action is for a future follow-up to the above analysis
SEJ-ready “known unknowns” layer (this is how we formalize the ranges next update)
This is the structure we’d use for structured expert judgment (SEJ) without pretending we’ve done the elicitation already:
For each element, define distributions for:
-
-
-
Trigger/threshold (in °C or physical proxy)
-
Exposure duration to trigger commitment (years above threshold)
-
Lag to observable transition (years/decades)
-
Magnitude distribution (e.g., PgC, m sea level, °C regional shift)
-
Coupling strength to other nodes (edge weights + lag)
-
-
References
-
-
Job One “pressure point” lists and subsystem set
-
NASA explainer on water vapor amplifying warming
-
IPCC AR6 Technical Summary (positive water vapor + surface albedo feedbacks)
-
IPCC AR6 WG1 Ch.5 (carbon cycle + ocean acidification context)
-
Global Carbon Budget 2024 (land/ocean sink accounting)
-
Schuur et al. (Nature 2015) permafrost carbon feedback
-
IPCC AR6 FAQs on hydrates (small modeled atmospheric contribution this century)
-
AMOC risk (debate set): Ditlevsen 2023 vs Baker 2025 vs van Westen 2024
-
Fire emissions escalation (Science 2024)
-
Amazon critical transitions (Nature 2024)
- Global Tipping Points Report (2023) (interactions + early warning), Armstrong McKay et al. (2022) reassessment of tipping thresholds
- the post-AR6 AMOC early-warning literature.
-
To help do something about the climate change and global warming emergency, click here.
Sign up for our free Global Warming Blog by clicking here. (In your email, you will receive critical news, research, and the warning signs for the next global warming disaster.)
To share this blog post: Go to the Share button to the left below.
Showing 1 reaction